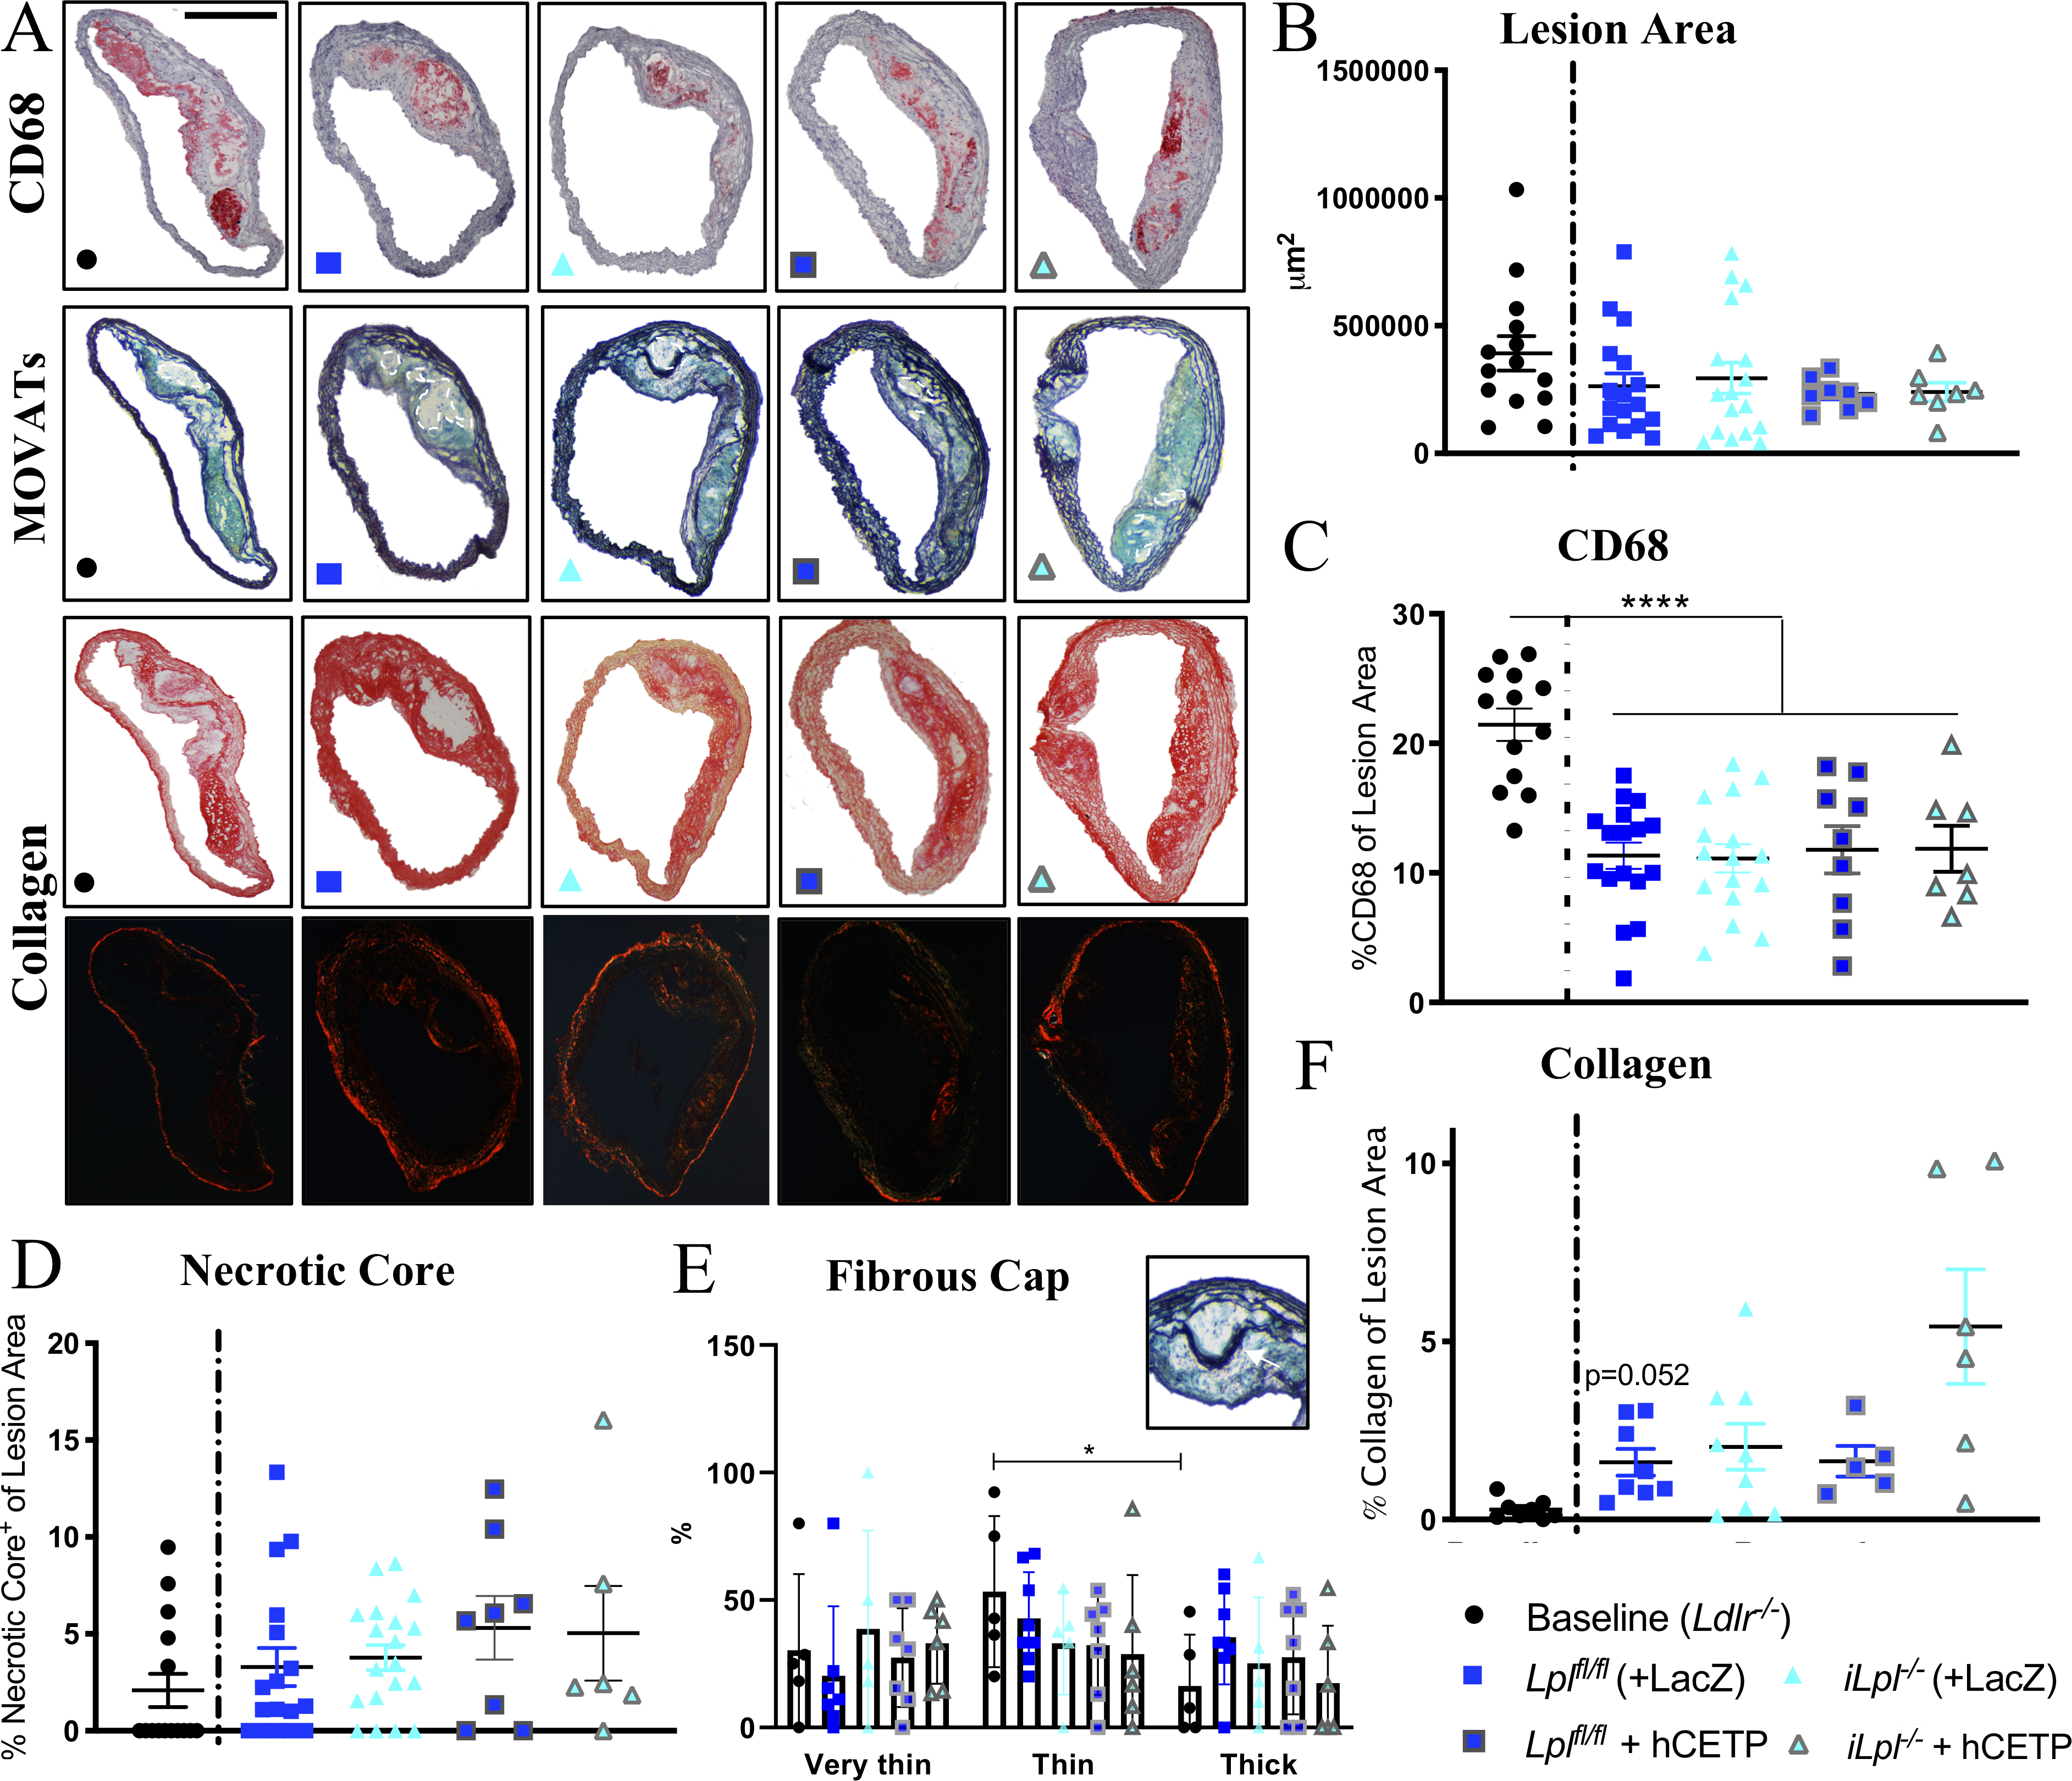
Figure 2. HyperTG due to global LpL deficiency does not affect atherosclerosis regression in the aortic transplant mouse model.

(A) Representative stainings; CD68, MOVATs, Picrosirius Red Staining (brightfield & polarized light); scale bar = 500 μm. Quantification of (B) Lesion Area (μm2) and (C) CD68 Area (% of Lesion Area ) (D) Necrotic Core (% of Lesion Area) (E) Fibrous Cap determined by number of layers above the Necrotic Core, Thick >10layers, Thin 5–10layers, Very Thin <5 layers; scale bar = 100 μm (F) Collagen (% of Lesion Area); N= (B, C, D) Baseline 15, Lplfl/fl 18, Lpl−/− 16, Lplfl/fl +hCETP 8, Lpl−/− + hCETP 6; (E) Baseline 5, Lplfl/fl 7, Lpl−/− 5, Lplfl/fl +hCETP 7, Lpl−/− + hCETP 6 (F) Baseline 8, Lplfl/fl 8, Lpl−/− 9, Lplfl/fl +hCETP 5, Lpl−/− + hCETP 6. Data represented as mean ± SEM, **** P < 0.0001, 1-way ANOVA with Tukey’s multiple comparison test; (E) 2-way ANOVA with Tukey’s multiple comparison test (F) Welch ANOVA with Games-Howell’s multiple comparison test.
