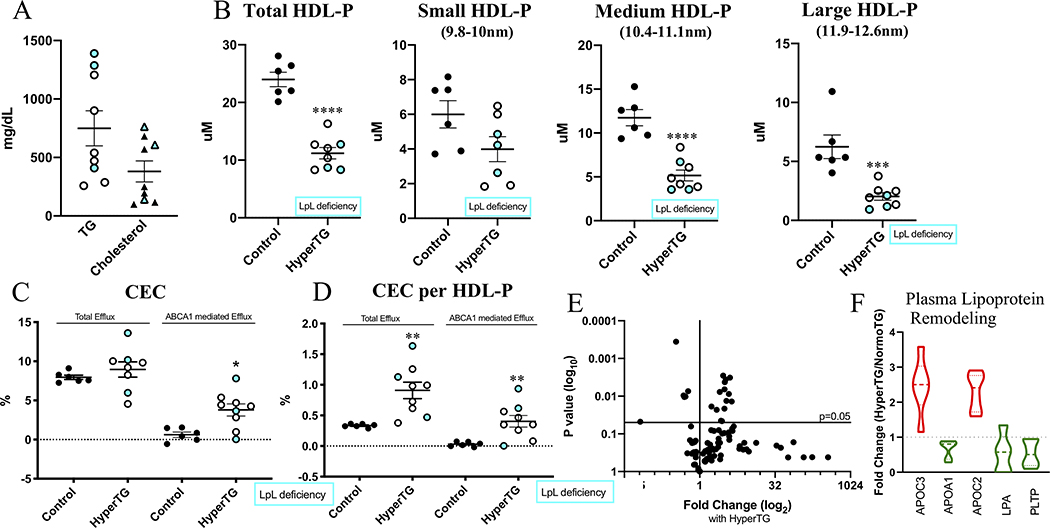
Figure 6. Subjects with HyperTG, incl. LpL deficient subjects show decreased HDL-P, but no impairment in CEC.
(A) Plasma TG and Cholesterol levels (mg/dL). (B) total HDL-P and HDL-P subsets. (C) Total and ABCA1-mediated CEC (%). (D) CEC per HDL-P (E) Volcano-plot of HDL Proteomics showing changes with HyperTG. (F) Main regulated proteins are part of plasma lipoprotein remodeling pathway. White-filled dots refer to HyperTG patients, blue filled dots refer to LpL deficient patients. Proteomics normalized to spiked ApoA-I; complete list of proteins can be found in Supplemental Table VI. N=6 (Control), N=9 (HyperTG). * P < 0.05, ** P<0.01, **** P < 0.0001, students unpaired t-test; (C, D) Mann-Whitney test.

