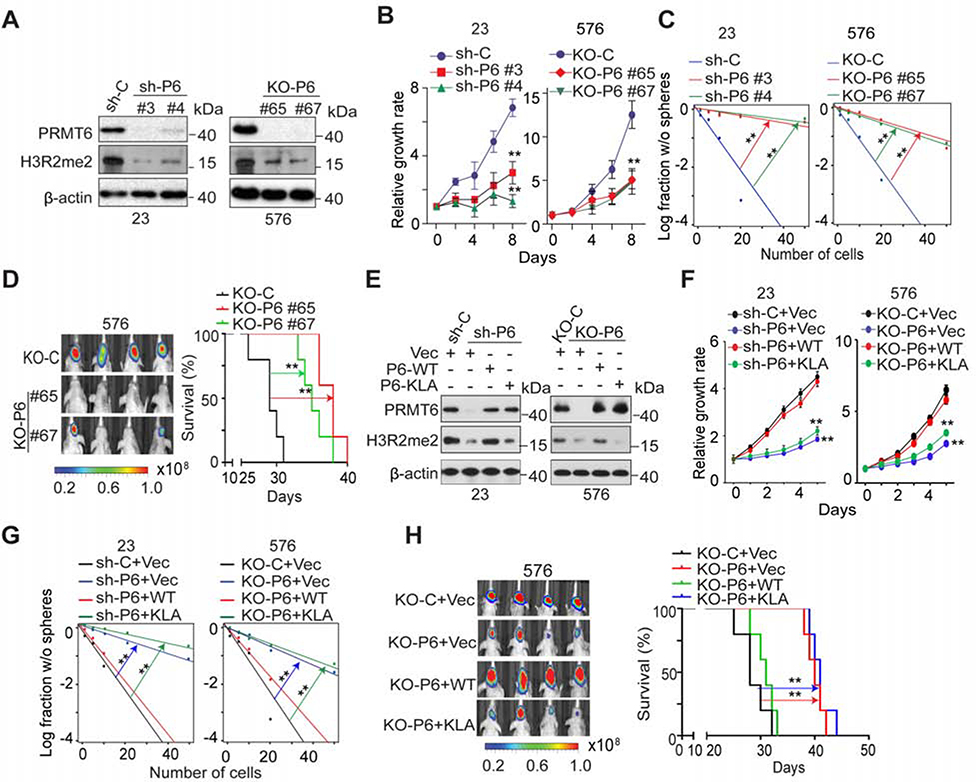
Figure 2. PRMT6 Expression Influences Growth, Self-Renewal, and Tumorigenicity of GSCs.
(A) IB for PRMT6 and H3R2me2 in GSC23 and 576 with indicated modifications.
(B and C), Effects of PRMT6 KD or KO on cell proliferation (B), sphere-forming frequency (C) of GSC23 and 576.
(D) BLI of GBM brain xenografts derived from the luciferase-labeled GSC576 with indicated modifications (left). Kaplan-Meier analysis of mice received indicated GSC576 (n=5/group, right).
(E) IB for PRMT6 and H3R2me2 in GSC23/PRMT6 KD and 576/PRMT6 KO cells with indicated modifications. PRMT6-KLA, a catalytically inactive PRMT6.
(F and G) Cell proliferation (F) and sphere-forming frequency (G) of GSC23/PRMT6 KD and 576/PRMT6 KO cells with indicated modifications.
(H) BLI of GBM brain xenografts of GSC576/PRMT6 KO with indicated modifications (left). Kaplan-Meier analysis of mice received indicated GSC576 cells (n = 5, right).
Colored scale bars in (D) and (H) represent photons/s/cm2/steradian. Data in (B, F) are means ± SEM, n=4. **p < 0.01. **p <0.01.
Data are representative of two to three independent experiments with similar results.
See also Figure S2.

