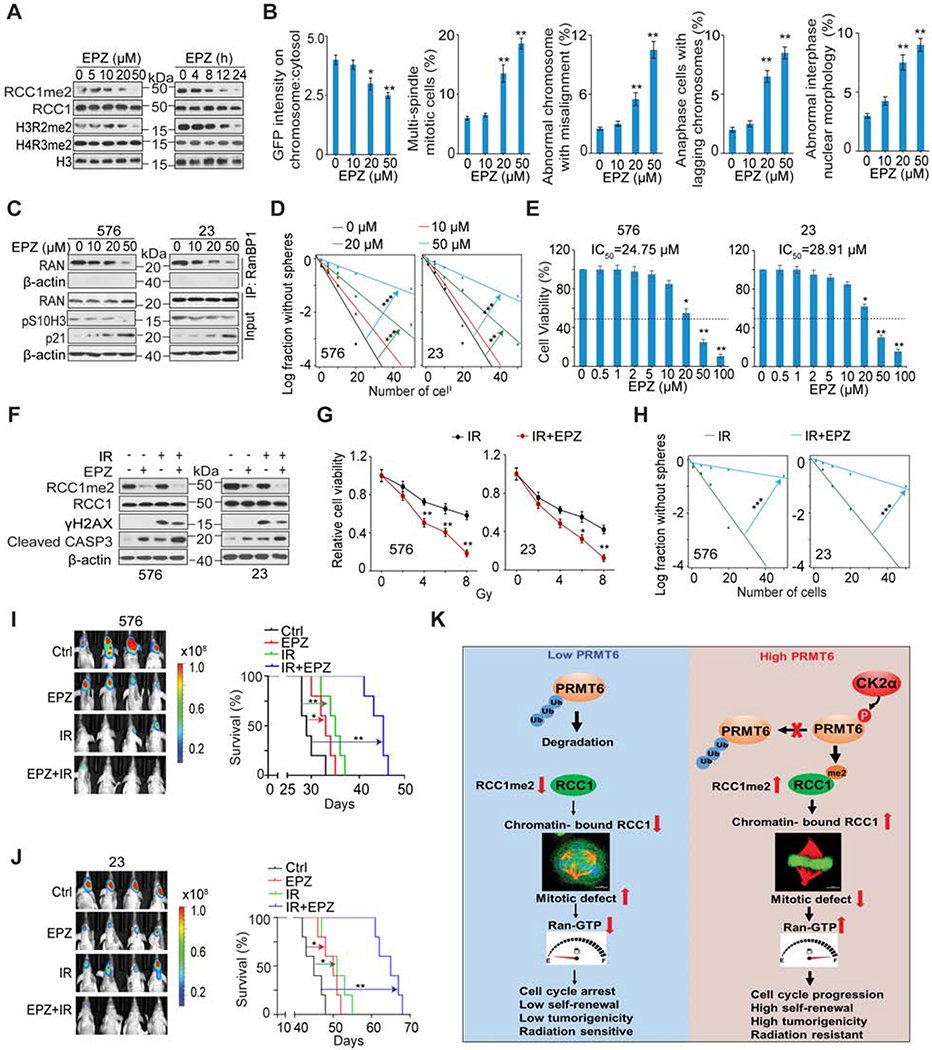
Figure 7. EPZ020411 (EPZ) Inhibition of PRMT6 Attenuates the Tumor-Initiating Ability of GSCs and Sensitizes GSC Tumor Xenografts to Ionizing Radiation (IR).
(A) IB for indicated proteins in GSC576 cells that were treated with the indicated concentrations of EPZ for 12 h (left) or with 20 μM EPZ for the indicated times (right).
(B) Chromosomal:cytosolic RCC-GFP and frequencies of indicated defects in mitotic and interphase in GSC83 cells with the indicated concentrations of EPZ for 12 h. n=50 mitotic cells for each condition.
(C) IP-IB and IB for indicated proteins in GSC576 and 23 were treated with the indicated concentrations of EPZ for 12 hr.
(D) Sphere-forming frequency for GSC576 and 23 with the indicated concentrations of EPZ for 12 h.
(E) Cell viability for GSC576 (left) and 23 (right) cells treated with indicated concentration of EPZ for 5 days.
(F) IB for indicated proteins in GSC576 and 23 treated with DMSO, 20 μM EPZ, IR (5 Gy), or EPZ + IR in 2 days post IR. γH2AX was detected at one hour after IR.
(G and H) Cell viability (G) and sphere-forming frequency (H) for GSC576 and 23 cells at day 5 after indicated treatments.
(I and J) Representative BLI images and Kaplan Meier analysis of GBM brain xenografts of GSC576 (I) and 23 (J) with indicated treatments (n=5/group). Colored scale bars represent photons/s/cm2/steradian.
(K) Illustration of the CK2α-PRMT6-RCC1 axis in the regulation of cell mitosis and tumorigenicity of GBM.
Data in bar or line graphs are means ± SEM, *, p < 0.05; **, p < 0.01; ***, p < 0.01;
Data are representative of two to three independent experiments with similar results.
See also Figures S7 and S8.

