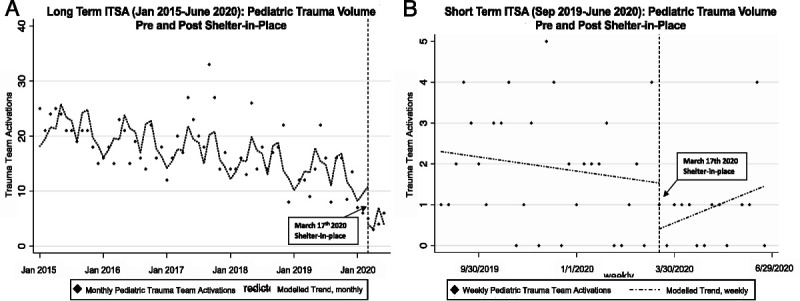
Figure 3.

Comparison of pediatric trauma volume before and after shelter-in-place. (A) Long-term ITSA for pediatric trauma volume at monthly intervals, showing a slight decline over past 5 years. Pre–shelter-in-place trend from January 2015 to February 2020 was 0.14 fewer pediatric trauma team activations per month (p < 0.01), with a significant level shift associated with shelter-in-place of 7.0 fewer pediatric trauma team activations (p < 0.01), and increases from March to June not different from corresponding months in prior years (p = 0.72). (B) Short-term ITSA for pediatric trauma volume at weekly intervals demonstrated a decreasing pre–shelter-in-place 6 month trend (coefficient −0.10, p < 0.01), a level shift by one less pediatric trauma team activation per week associated with the first week of shelter-in-place (p < 0.14), post–shelter-in-place trend of 0.15 more trauma team activations per week (p < 0.09), and a slope change from pre– to post–shelter-in-place of 0.25 (p = 0.01). Lags specified for autocorrelation: 12 months in long-term ITSA and 4 weeks in short-term ITSA. See Supplemental Tables 3 and 4 (http://links.lww.com/TA/B859) for complete ITSA model results.
