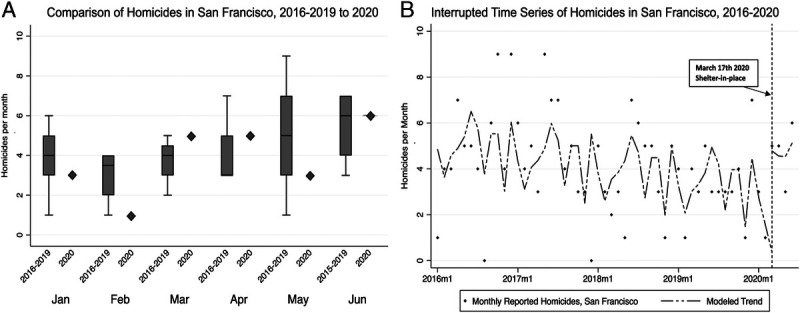
Figure 6.

Comparison of number of monthly homicides reported in San Francisco before and after shelter-in-place. (A) Box and whiskers plots of historical homicides reported by month 2016–2019 compared with 2020 values (diamonds). (B) ITSA model for homicides reported by month adjusting for historical variation, showing slight downtrend with seasonal monthly variation from 2016 to 2019, but with a significant level shift increase associated with shelter-in-place of 2.3 more homicides per month compared with historical levels (p = 0.01) and nonsignificant decrease after shelter-in-place (p = 0.15). Lags specified for autocorrelation: 12 months. See Supplemental Table 7 (http://links.lww.com/TA/B859) for complete ITSA model results.
