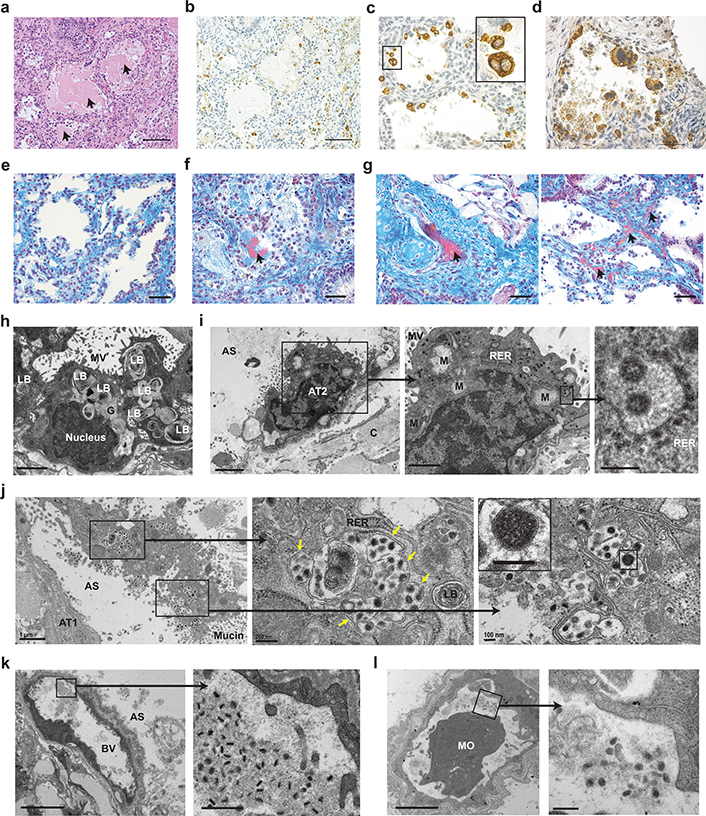
Fig. 2. Acute SARS-CoV-2 infection is highly cytopathic and causes extensive damage to human lung structures.
a, H&E staining of a SARS-CoV-2 infected LoM human lung tissue 2 days post-exposure (scale bar, 100 um, n=6). Arrows indicate protein globules. b-d, Immunohistochemical staining for virus nucleoprotein in LoM human lung tissue 2 days following SARS-CoV-2 exposure (positive cells, brown; b scale bars, 100 um; c and d scale bars, 50 um, n=6). e-g, Martius Scarlet Blue staining of human lung tissue from e, naïve LoM (n=6) and f and g, SARS-CoV-2 infected LoM 2 days post-exposure (scale bars, 50 um; fibrin, red; collagen, blue, n=6). Arrows indicate the presence of fibrin (red) in f, alveoli or in g, thrombi of occluded vessels. h-l, Electron microscopy analysis of SARS-CoV-2 infected human lung tissue two days post-exposure (n=3). h, Uninfected AT2 cells in an alveolus-like structure. Scale bars, 2 um. i, SARS-CoV-2 infected AT2 cell. Higher magnification images of boxed areas show virus particles with dense nucleocapsids in RER. Scale bars, 2 um (left image), 1 um (middle image), and 200 nm (right image). j, Degenerative SARS-CoV-2 infected cell in the alveolar space. Arrows indicate virus filled vesicles. Scale bars, 1 um (left image), 200 nm (middle image), and 100 nm (right image). k and l, Blood vessels containing virions, fibrillar protein and cell debris. In k, scale bars, 5 um (left image) and 500 nm (right image). In l, scale bars, 2 um (right image) and 200 nm (left image). AS, alveolar space; AT1, alveolar type 1 cells; AT2, alveolar type 2 cells; BV, blood vessel; C, collagen; G, glycogen; LB, lamellar body; M, mitochondria; MO, monocyte; MV, microvilli; RER, rough endoplasmic reticulum. In c, i-l, black boxes indicate areas of higher magnification images. n= number of biologically independent lung tissues analyzed.

