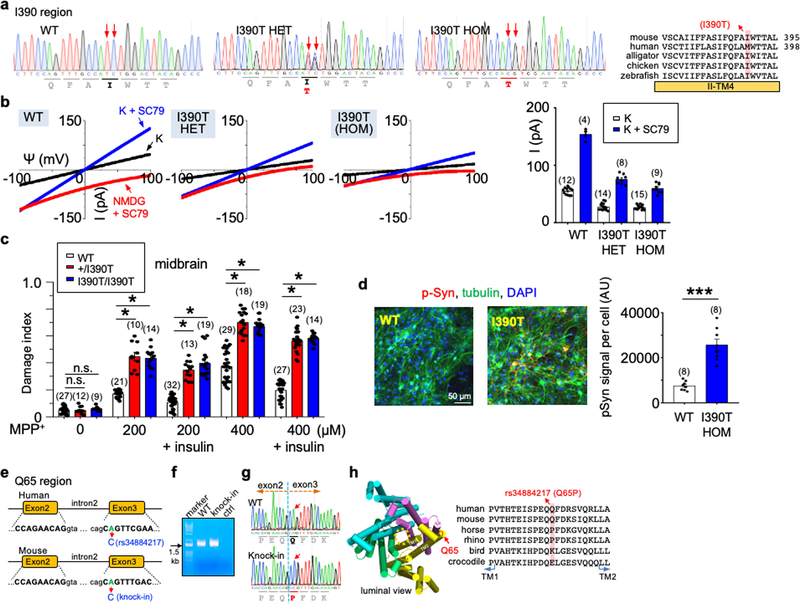
Extended Data Fig. 8 |. Knock-in mice to model common human variants p.M393T and p.Q65P.
a–d, Experiments demonstrating that the TMEM175(I390T) substitution in mice—corresponding to M393T in human TMEM175—leads to reduced lysosomal IK, accelerated spreading of pathogenic α-syn and increased neuronal damage. a, Sanger sequencing of genomic DNA PCR products from wild-type, heterozygous and homozygous TMEM175(I390T) knock-in mice in the I390-coding region. Residue I390 in mouse TMEM175 is equivalent to M393 in human TMEM175, as shown in the sequence alignment on the right. b, IK recorded from wild-type (+/+, wild type), heterozygous (I390T/+, het) and homozygous (I390T/I390T, hom) knock-in mouse midbrain neurons. Bar graphs show averaged IK (at 100 mV). Data are mean ± s.e.m. Numbers of recordings are in parentheses. c, Neuronal damages in wild-type, het and hom midbrain neurons treated with MPP+ with concentrations as indicated added to culture medium for 12 h and those followed by incubation with insulin (100 nM in DMEM) for 3 h. Damage index was calculated as the ratio of damaged area to the total neuronal area. d, Cultured wild-type and TMEM175(I390T) (hom) midbrain neurons were seeded with mouse α-syn PFFs and immunostained with anti-pSer129 α-syn (pSyn, red) two weeks later. β-Tubulin (green) was costained to highlight neuronal processes. DAPI (blue) nuclear staining was used to identify number of cells. Left two subpanels, representative images. Right, pSyn signals normalized to number of cells (n = 8 coverslips each). For c, d, see Fig. 5, Extended Data Fig. 10 for more details. P values in c are as follows (unpaired two-tailed t-tests, compared to wild type): 0 μM MPP+, P = 0.9318 (het), P = 0.2516 (hom); P < 0.0001 for all the other comparisons. The P value in d (t-test, wild type versus hom) is P < 0.0001. e–h, Characterization of the rs34884217 (p.Q65P) variant. e, Genomic structures of the human and mouse TMEM175 genes around the rs34884217 SNP region. The A-to-C variation in human and the corresponding substitution in the knock-in mouse line are indicated by arrows. f, Agarose gel electrophoresis showing RT–PCR products of the whole open reading frame cDNA (about 1.5 kb) amplified from wild-type and knock-in mouse brains. For gel source data, see Supplementary Fig. 1. g, Sanger sequencing results of the RT–PCR products in f, demonstrating that the A-to-C substitution in mice leads to a Q65P coding change. h, Sequence alignments around Q65 in the I-TM1–TM2 linker. Q65P is located at the luminal side of the channel entrance.

