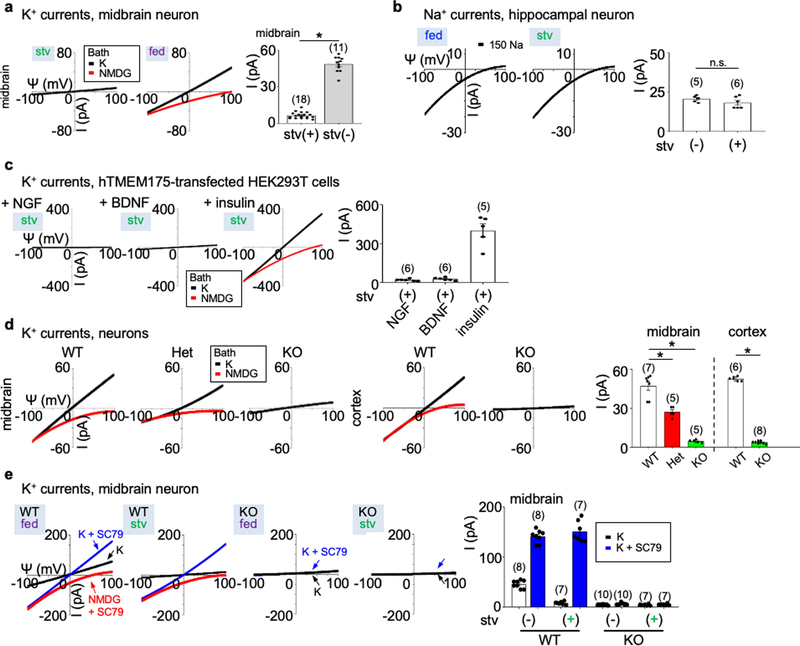
Extended Data Fig. 1 |. Lysosomal currents activated by growth factors.
Lysosomal currents were recorded using a ramp protocol (−100 mV to 100 mV ramp in 1 s with holding voltage of 0 mV) as illustrated in Fig. 1. a, Sizes of K+ currents (IK) recorded at varying voltages (Ψ, −100 mV to 100 mV) from midbrain neurons with (stv) or without (fed) overnight starvation in DMEM containing no B27 nutrient supplement. Averaged IK sizes (at 100 mV, recorded with 150 mM K+-containing bath) are in the right bar graph. Data are mean ± s.e.m. Numbers of recordings are in parentheses. *P < 0.0001, unpaired two-tailed t-test. b, Na+ currents recorded from hippocampal neurons with and without starvation demonstrating that B27 does not activate Na+ currents. The averaged current sizes (at −100 mV) are in the right bar graph (P = 0.226, unpaired two-tailed t-test). Solutions used in the recordings were the same as those used to record the IK in Fig. 1a, b, except that K+ in the bath was replaced with Na+ and 1 μM PI(3,5)P2 was added in the bath (lysosomal Na+ channel requires PI(3,5)P2 for maximum activation). c, IK recorded from TMEM175-transfected HEK293T cells starved in HBSS followed by refeeding with NGF (100 ng ml−1 for 3 h) or BDNF (10 ng ml−1 for 3 h), demonstrating that BDNF and NGF do not activate TMEM175 in HEK293T cells. Activation by insulin (right) was used as a positive control for receptor activation (see Fig. 1f for insulin). Averaged IK sizes (recorded with K+-containing bath, at 100 mV) are in the right bar graph. d, IK recorded from B27-replete midbrain and cortical neurons cultured from wild-type, heterozygous or TMEM175-knockout mice. Averaged IK sizes (at 100 mV, recorded with 150 mM K+-containing bath) are in the right bar graph. Data are mean ± s.e.m. Numbers of recordings are in parentheses. *P < 0.001, unpaired two-tailed t-test. P values (compared to wild type) are as follows: midbrain, P = 0.0007 for heterozygous, P < 0.0001 for knockout; cortex, P < 0.0001 for knockout. e, IK recorded from wild-type and TMEM175-knockout midbrain neurons before (fed) or after (stv) starvation (overnight in DMEM). An AKT activator SC79 (10 μM) was applied to the recording bath during some of the recordings (blue and red traces). Bar graphs in the right show averaged IK sizes (at 100 mV). Data are mean ± s.e.m. Numbers of recordings are in parentheses. Arrows are used to indicate curves that overlap and are not easily distinguished.

