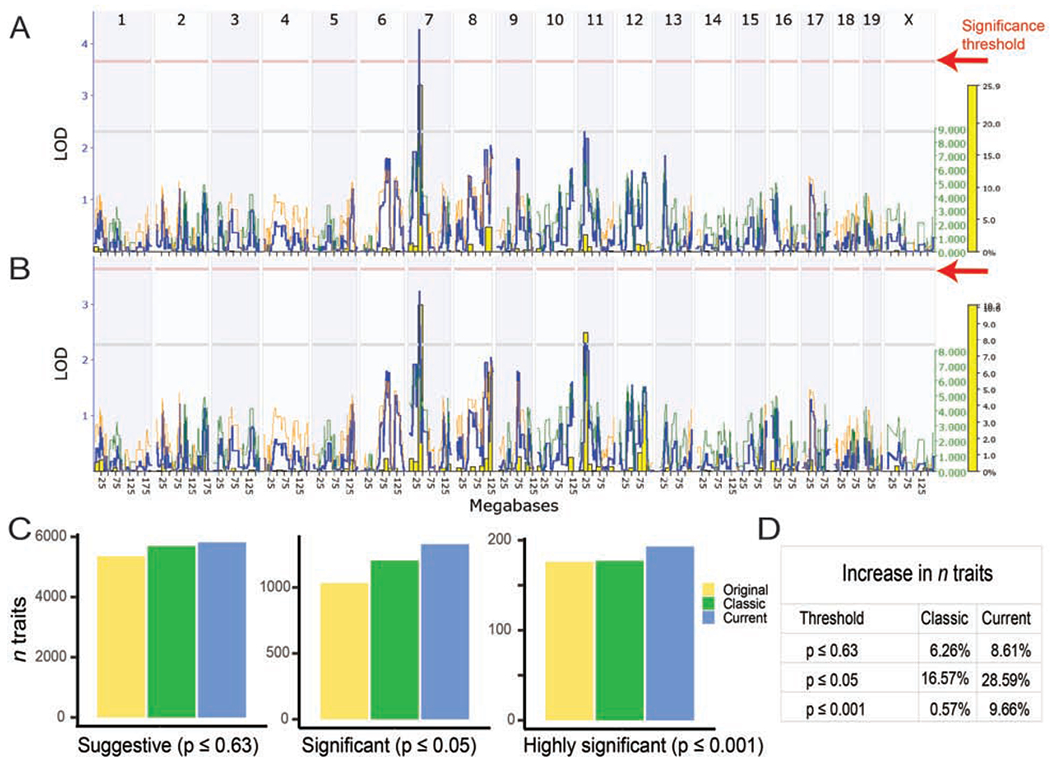
Figure 2: Improved, denser, genotypes increase linkage across chromosomes, decades of work, and number of strains.

Comparison of current (A) and classic (B) genotypes for BXD_10666, Cytotoxic T-cell (CTL) response (5 x 10^9 PFU AdLacZ iv), measured as interleukin 6 (IL-6) cytokine expression [pg/ml], published by Zhang et al., 2004, measured in 23 strains. A QTL on chromosome 7 is now significant (above the red p = 0.05 significance line) using the current genotypes (A), compared to the classic genotypes (B). Additional examples in Figure S2. (C) Bar chart showing the number of phenotypes with a peak LOD score over the suggestive (LOD ≥ 2.2; p ≤ 0.63), significant (LOD ≥ 3.6; p ≤ 0.05) and highly significant (LOD ≥ 5.4; p ≤ 0.001) thresholds, using original, classic or current marker maps. (D) Percentage increase in the number of traits passing the thresholds in the classic or current genotype map, compared to the original map.
