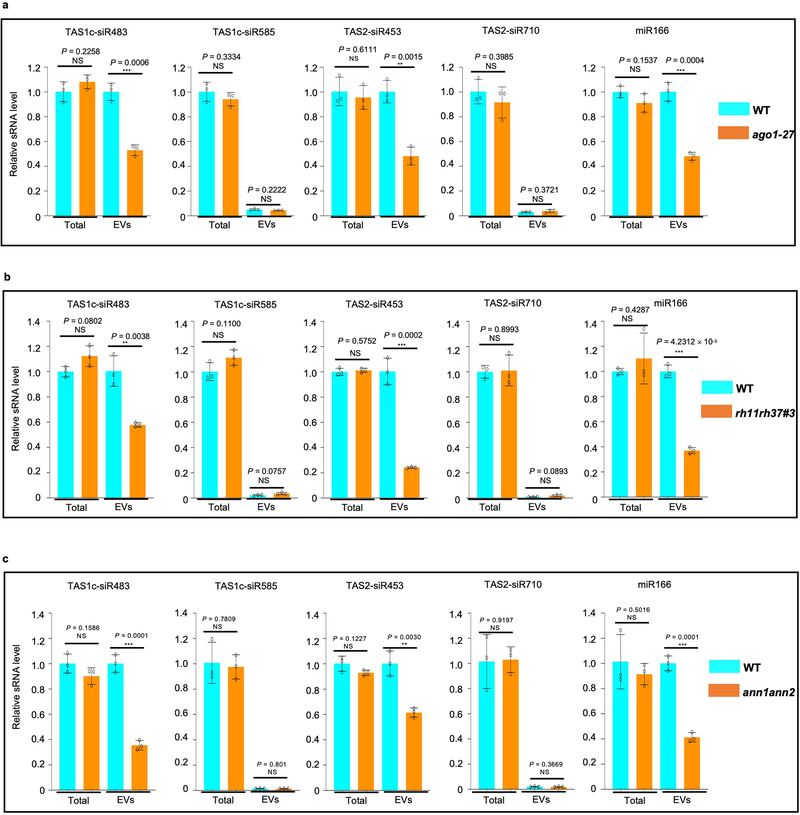
Extended Data Fig. 9. EV-enriched sRNA amount was reduced in EVs isolated from EV-associated RBP mutants.
The relative level of both EV-enriched and non-EV-enriched sRNAs were examined by real-time RT-PCR in the total fraction and EV fraction from ago1–27 (a), rh11rh37 (b) and ann1ann2 (c) mutants. The data are presented as mean ± s.d., n = 3 biologically independent replicates. The error bars indicate the standard deviation (s.d.). The statistical analysis was performed using unpaired two-tailed Student’s t-tests. The small open circles represent the individual values. The asterisks indicate significant differences: **P < 0.01, ***P < 0.01, NS, not significant.

