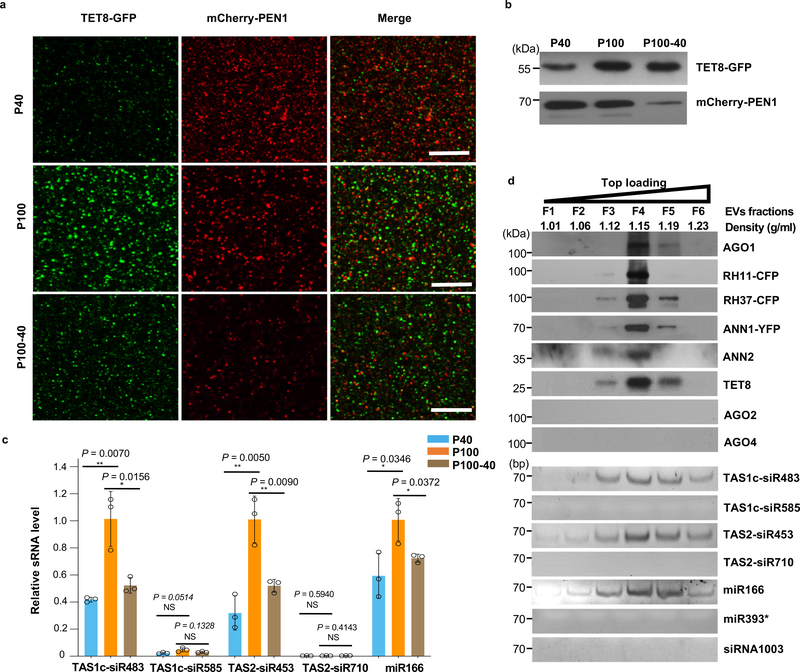
Fig. 2. TET8 and PEN1 label different classes of EVs in Arabidopsis.
a, Confocal microscopy of EVs isolated from B. cinerea-infected TET8-GFP/mCherry-PEN1 double fluorescence plants by ultracentrifugation at 40,000 g (P40 fraction) and 100,000 g (P100 fraction) for 1 hour. For the P100–40 fraction, the supernatant of P40 fraction was centrifuged at 100,000 g for 1 hour. Scale bars, 10 μm. b, Detection of GFP-labeled TET8 and mCherry-labeled PEN1 in P40, P100, and P100–40 EV fractions by western blot. c, EV-enriched sRNAs were detected in P40, P100, and P100–40 EV fractions by real-time-RT PCR. The data are presented as mean ± s.d., n = 3 biological replicates. The error bars represent standard deviations (s.d.). d, Six fractions were collected from top loading plant EV sucrose gradient centrifugation and analyzed for protein content by western blot and for sRNAs by RT-PCR. AGO1, AGO2, AGO4, RH11, RH37, ANN1, ANN2 and TET8 proteins were detected by western blot. EV-enriched sRNAs (TAS1c-siR483, TAS2-siR453 and miR166), non-EV-enriched sRNAs (TAS1c-siR585 and TAS2-siR710), AGO2-associated miR393* and AGO4- associated siRNA1003 were detected by RT-PCR. All EVs used here were not pretreated with trypsin and RNase. The statistical analysis was performed using analysis of variance (ANOVA) Dunnett’s multiple comparisons test. The small open circles represent the individual values. The asterisks indicate significant differences: *P < 0.05, **P < 0.01. NS, not significant. The experiments in Fig. 2a-b, d were repeated three times independently with similar results. Source data are provided as a Source Data file.

