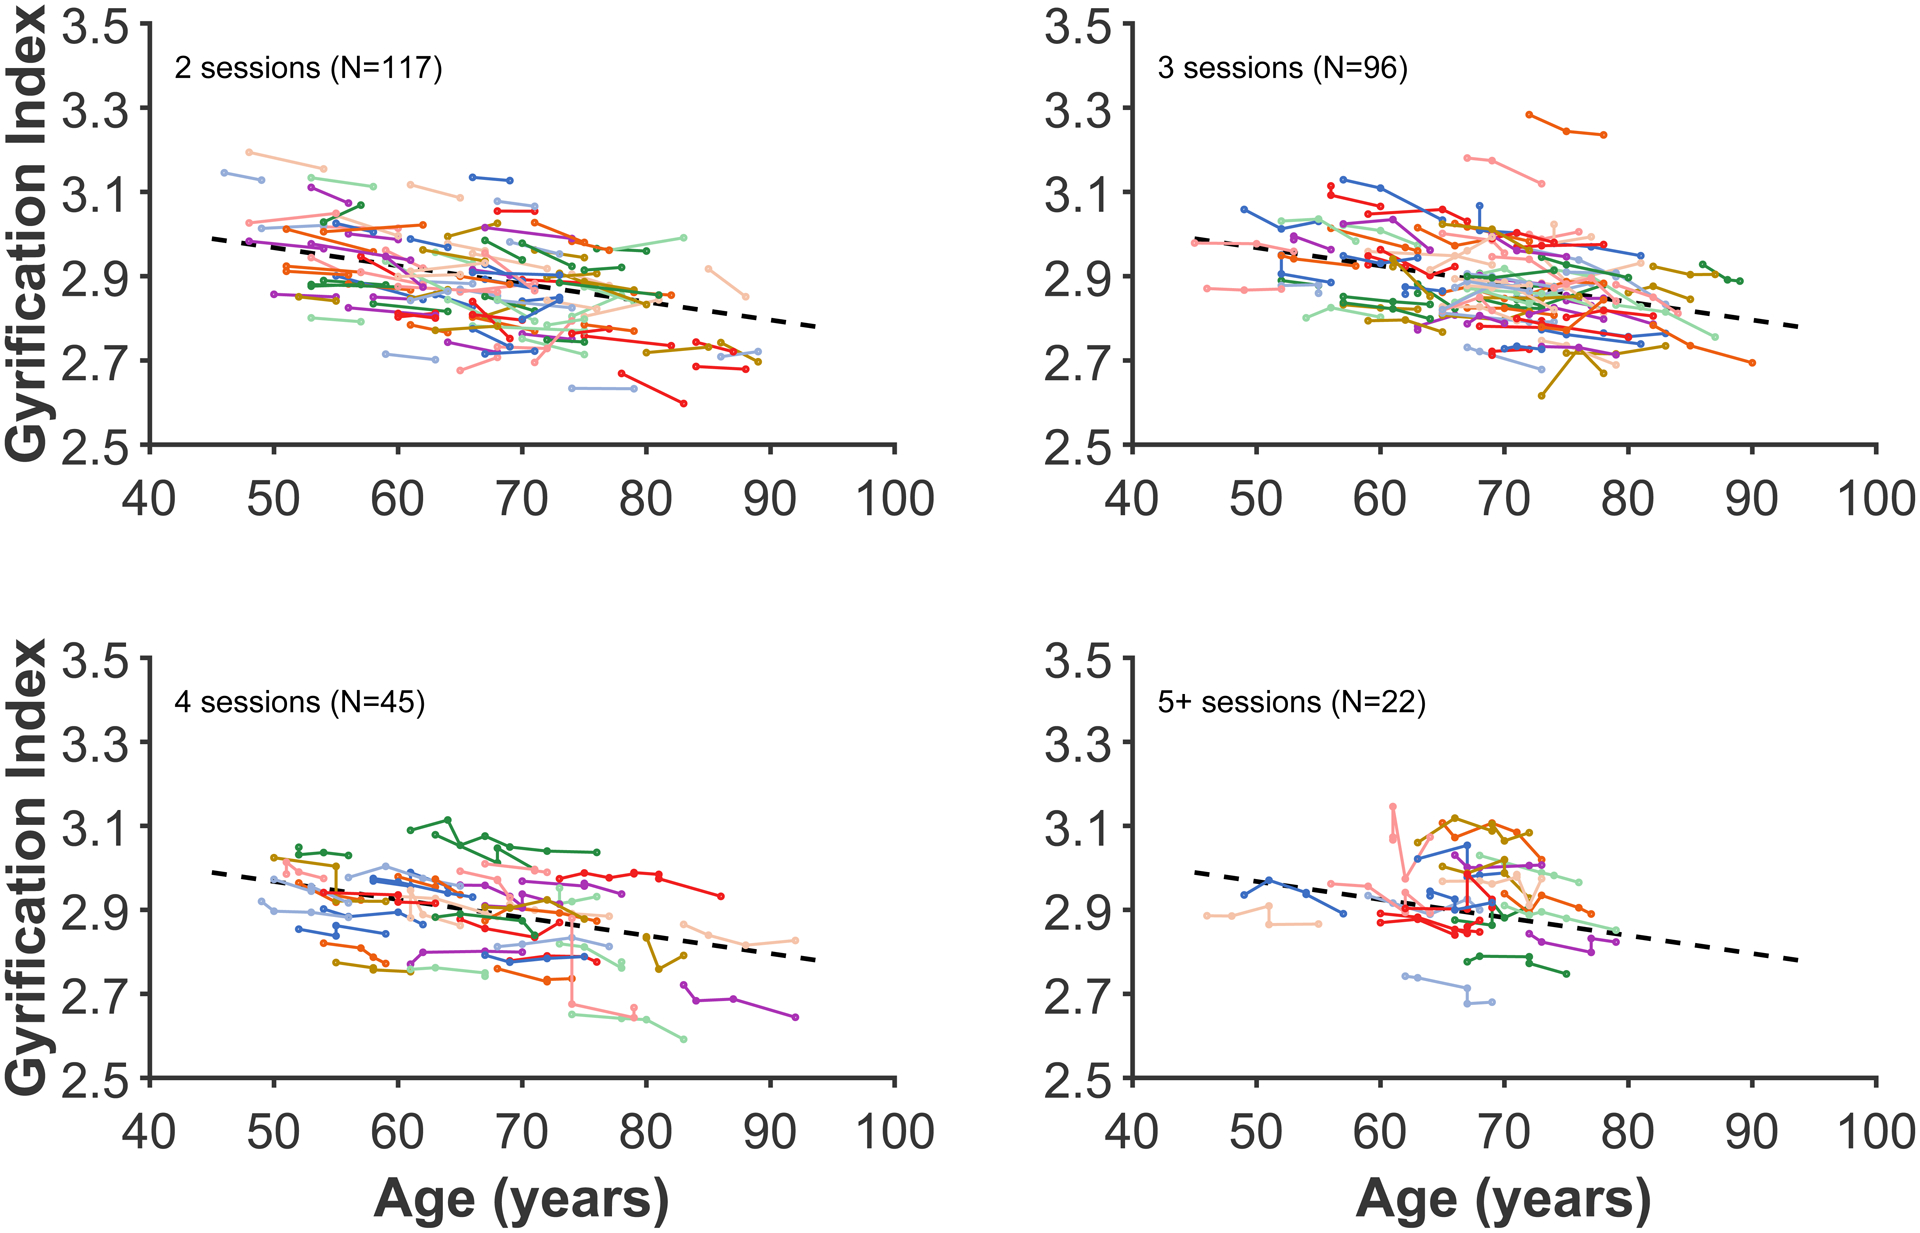
Figure 3. Age changes in global gyrification.

Each coloured line represents an individual participant, with each dot corresponding to an MRI session. The plot has been divided into panels for each set of timepoints to improve readability. Dashed line present in all panels show the decrease in global gyrification based on all data, estimated using the linear mixed effects model.
