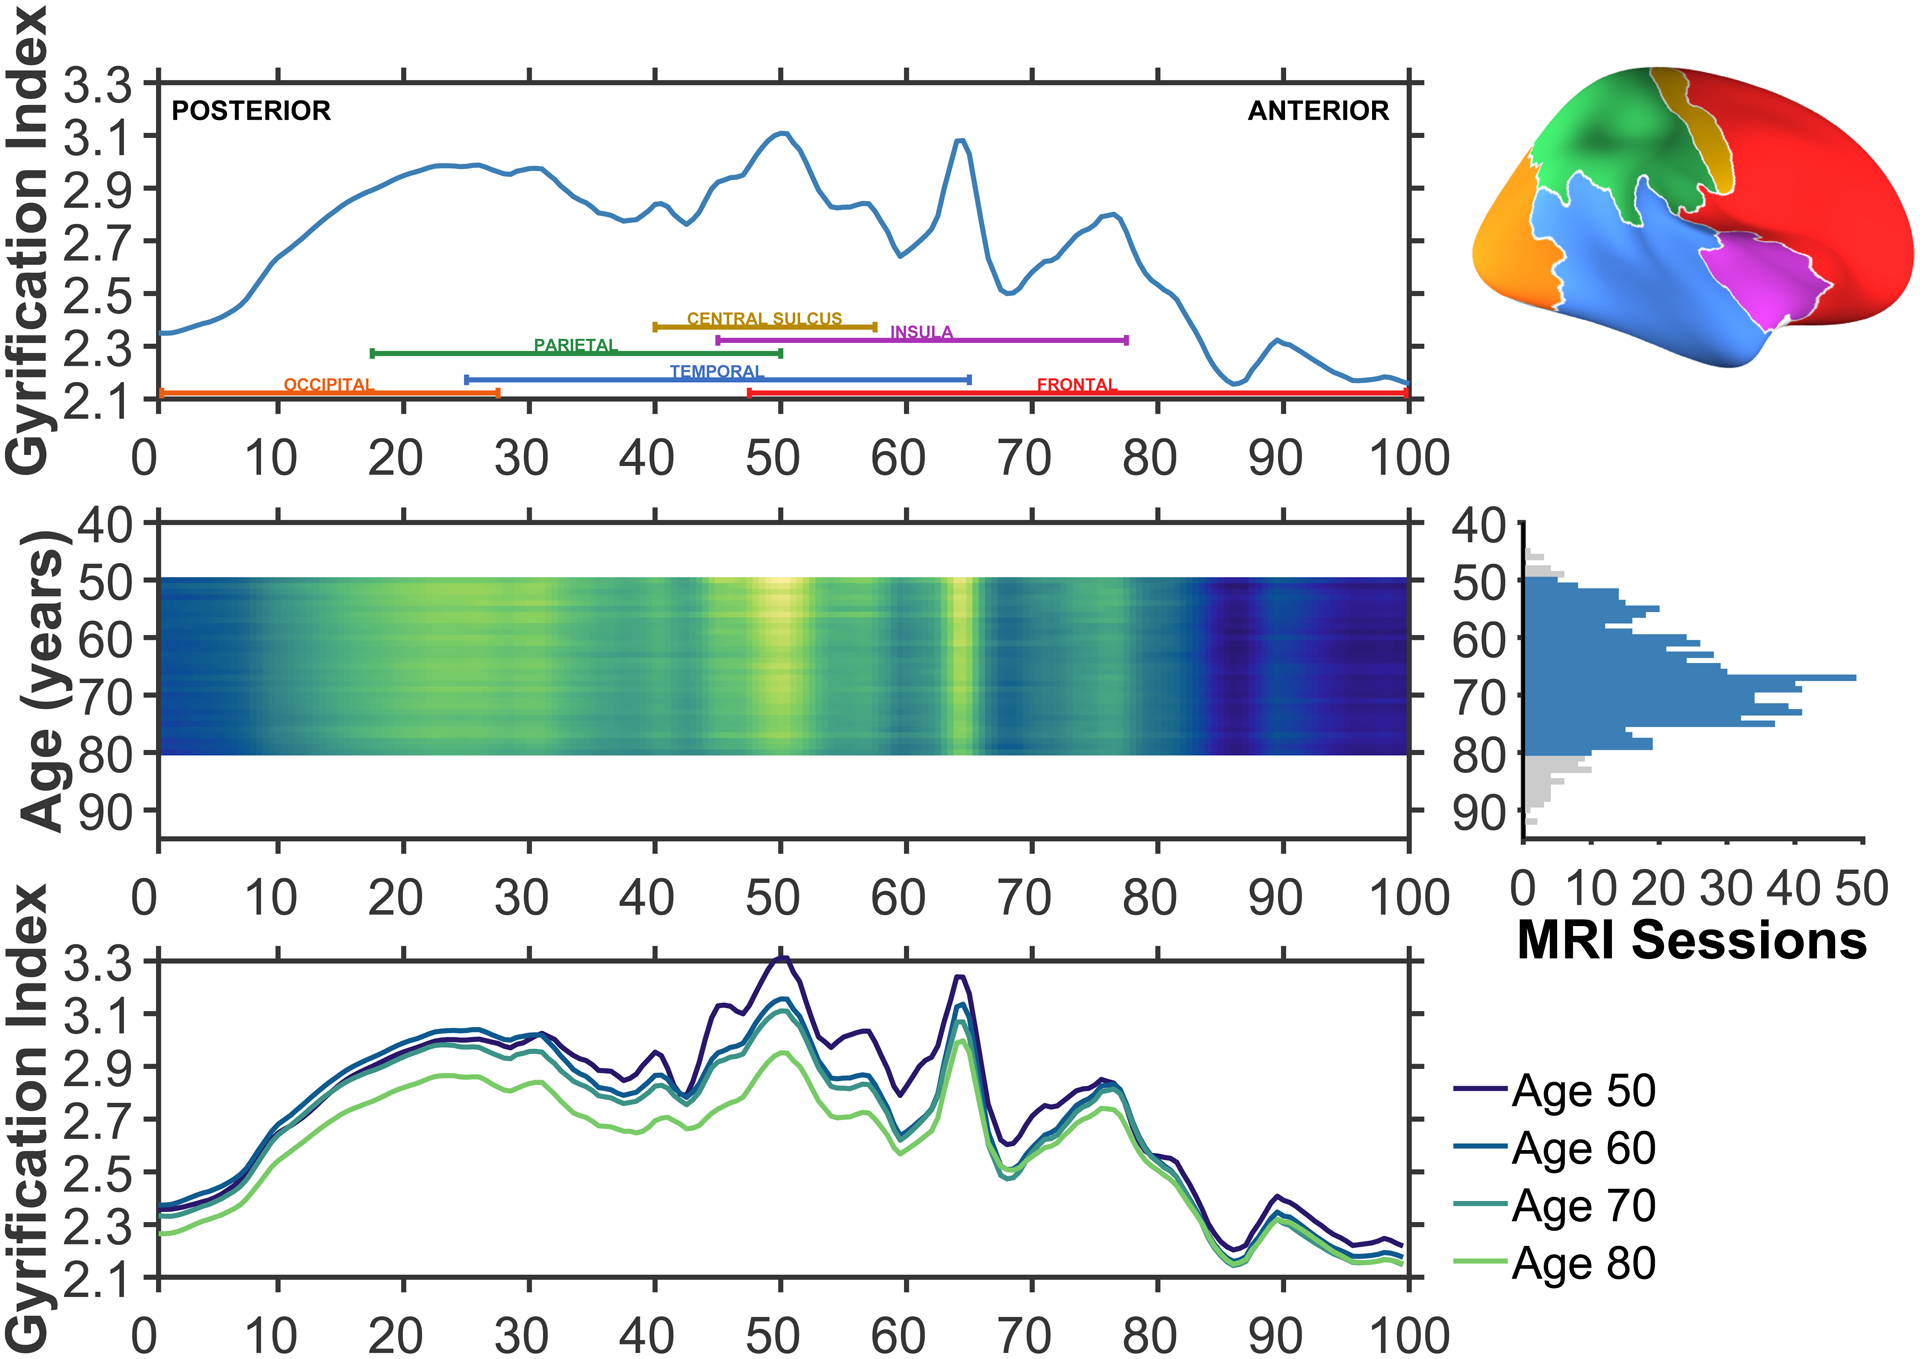
Figure 4. Gyrification index across posterior (percentile 0; caudal) to anterior (percentile 100; rostral).

The upper row illustrates the average gyrification across the common surface space. Coloured labels denoting each of the four lobes (frontal: red; parietal: green; temporal: blue; occipital: orange), insula (purple), and central sulcus (yellow) are included to aid in interpretation. An inflated cortical surface is shown on the right to help visualise the relative extents of these regions, though a folded brain was used for the actual analyses. The middle row shows the mean anterior-posterior gyrification for each age between 50 and 80, inclusive; brighter colours denote regions of higher gyrification index. This subset of ages was selected based on having sufficient sessions per age to use in the estimation, as shown in the right panel. A total of 746 of the available 815 MRI sessions were in this age range. The lower row shows the mean anterior-posterior gyrification for individuals aged 50, 60, 70, and 80. Aging is associated with overall decreases in gyrification, but these appear to be most pronounced in the parietal lobe.
