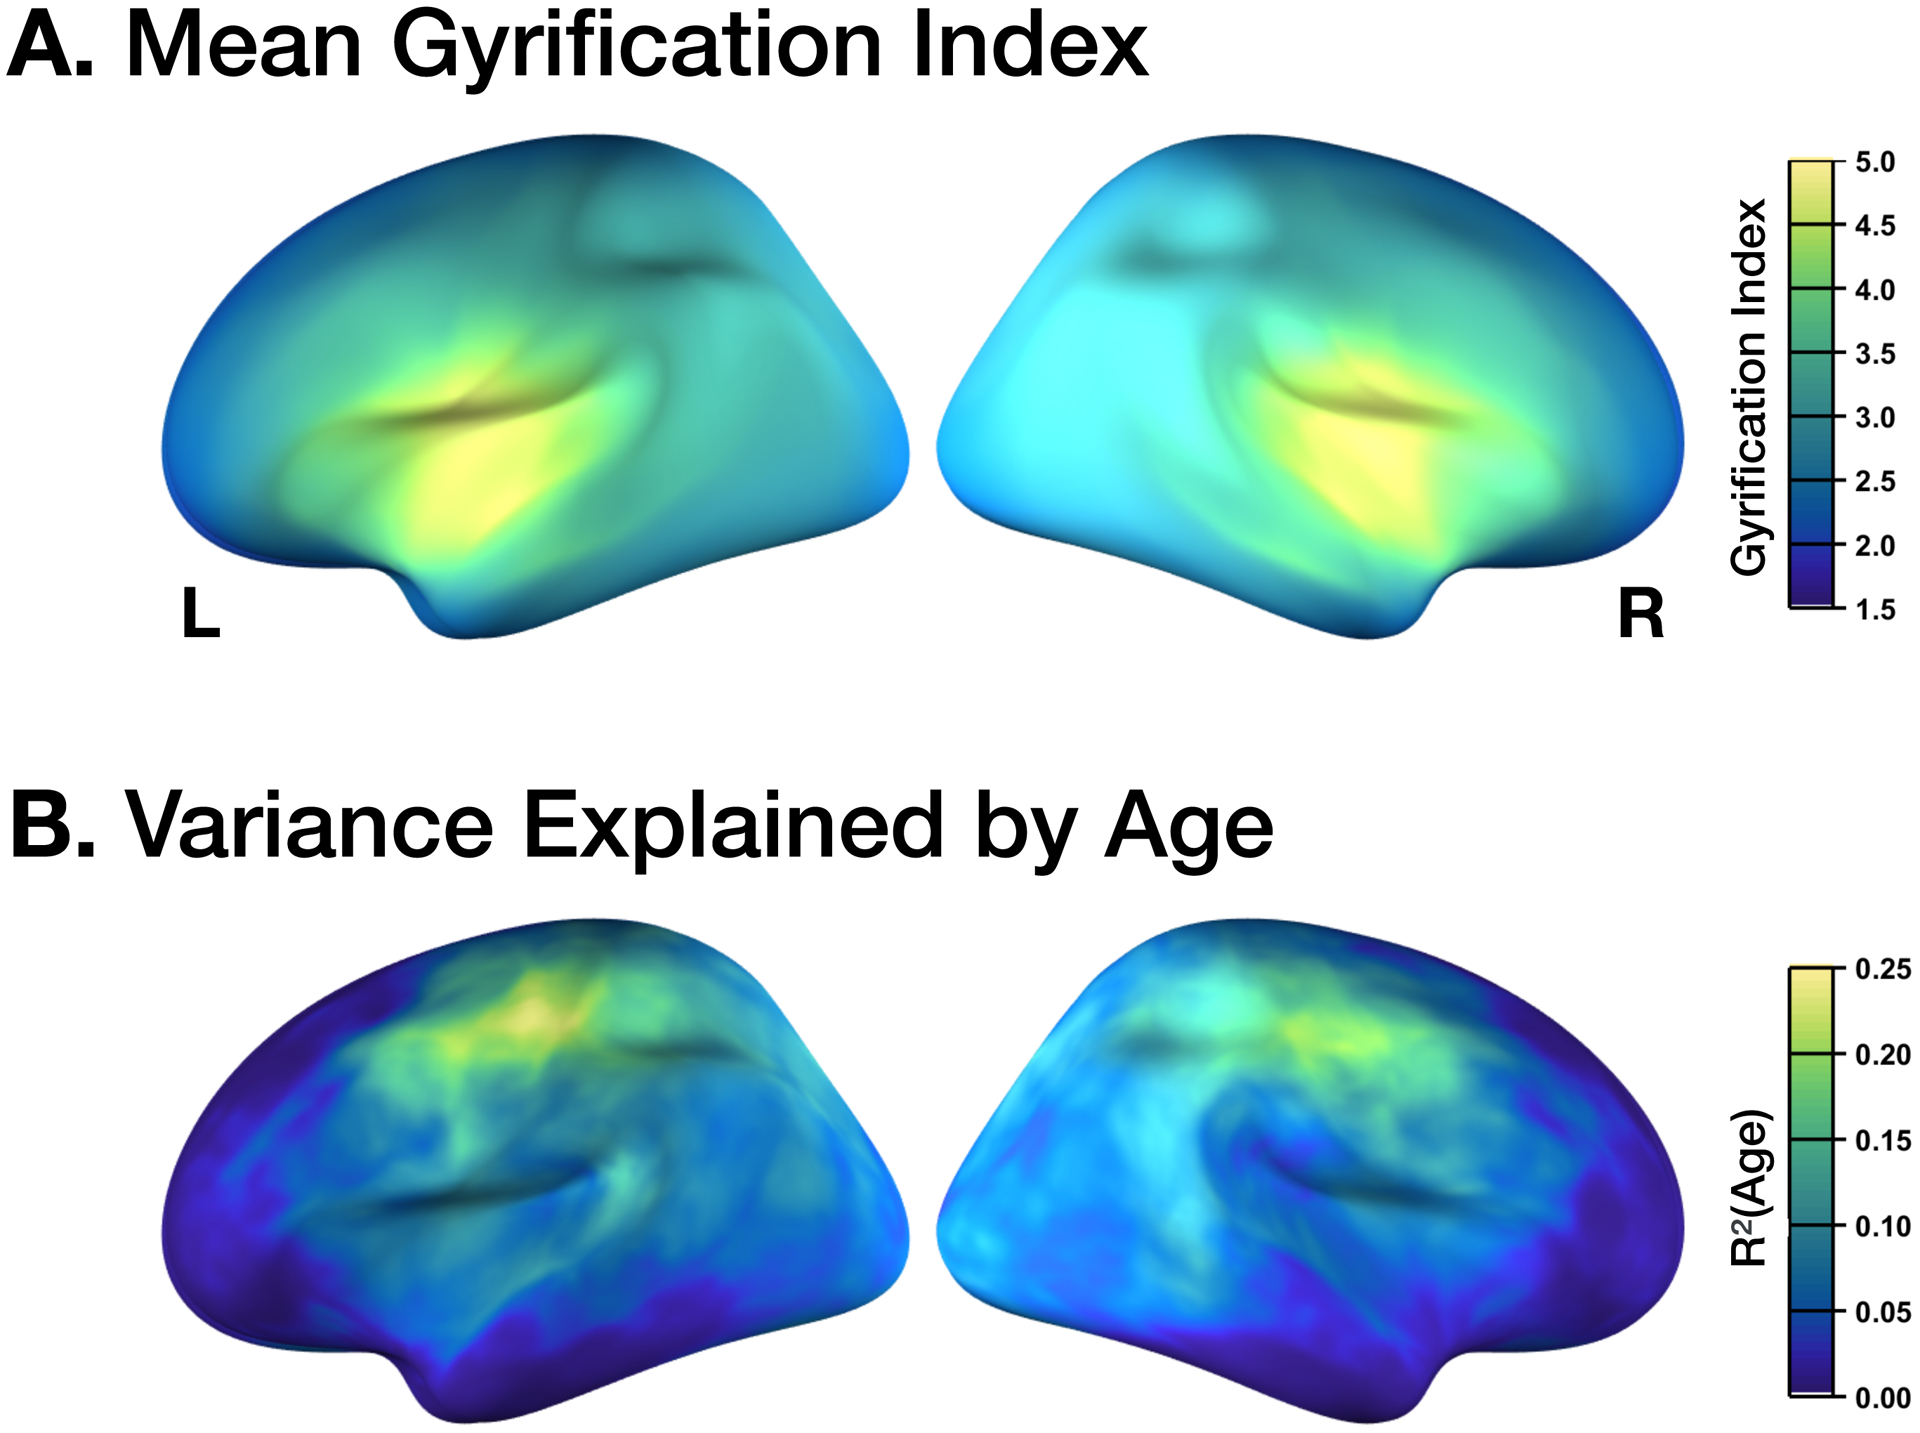
Figure 5. Topography of gyrification.

(A) Mean gyrification, with the highest values corresponding to the insula. (B) Age changes in gyrification, with the highest values corresponding to the parietal lobe and posterior aspects of the frontal lobe (i.e., primary motor and somatosensory regions). Values determined based on vertex-wise regression of local gyrification index with age.
