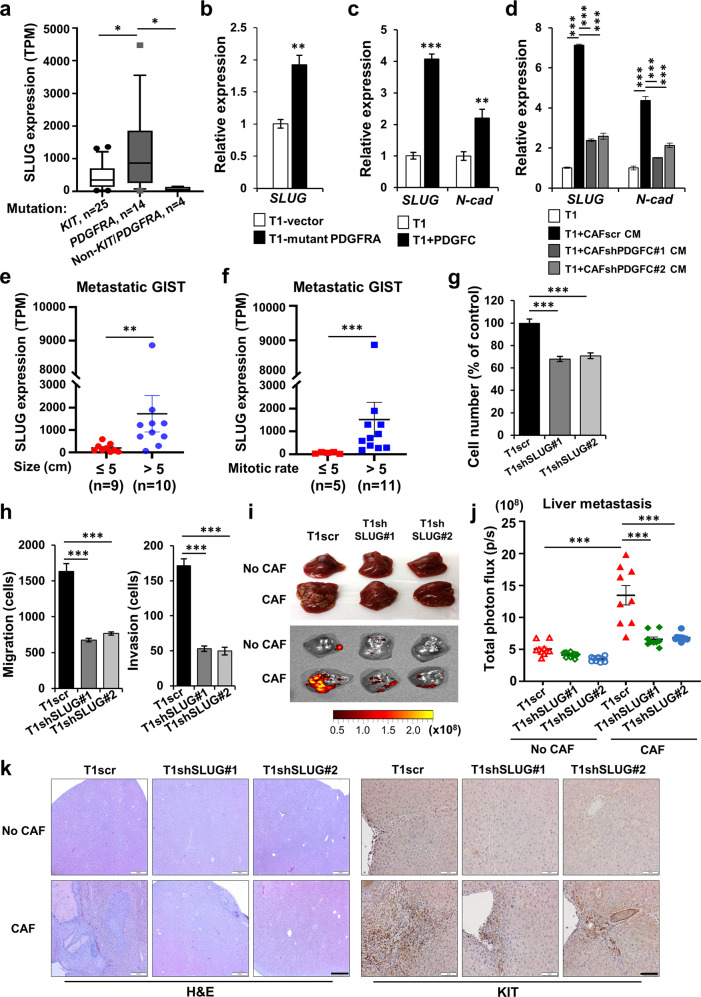
Fig. 5. Expression of SLUG, an EMT transcription factor, is associated with high-risk pathologic features in human GIST.
a SLUG expression in human GIST harboring mutations (KIT, n = 25; PDGFRA, n = 14; non-KIT/PDGFRA, n = 4). p values were represented by Mann–Whitney U test. *p < 0.05. TPM; Transcripts Per Kilobase Million. b mRNA expression of SLUG by qPCR in T1 with empty vector and T1 with mutant PDGFRA overexpression. p values were represented by Student’s t test. **p < 0.01. qPCR expression of SLUG and N-cadherin (N-cad) in T1 cells treated with rPDGFC (10 ng/mL); (c) and conditioned media (CM) from CAFscr, CAFshPDGFC #1, and CAFshPDGFC #2 (d). p values were represented by Student’s t test or ANOVA analysis. **p < 0.01, ***p < 0.001. Correlation of SLUG gene expression with tumor size (e) and mitotic index (f) in metastatic human GISTs. Patient numbers (n) for each group are indicated. p values were represented by Mann–Whitney U test. **p < 0.01, ***p < 0.001. g Proliferation showing the effect of stable SLUG knockdown. After the cells were plated for 72 h, the number of cells were counted using an Automated Cell Counter. p values were represented by ANOVA analysis. ***p < 0.001. h Transwell migration and invasion assays in T1scr and T1shSLUG #1–2. Data represents average number of cells migrated from migration and invasion assays. Scale bars, 200 µm. p values were represented by ANOVA analysis. ***p < 0.001. i, j Effects of SLUG on spleen-to-liver metastasis. The mice were injected with GFP-labeled T1scr, T1scr + CAF, T1shSLUG#1, T1shSLUG#1 + CAF, T1shSLUG#2, and T1shSLUG#2 + CAF. The mice were sacrificed on day 21 after the cell injection. Representative photographic images and IVIS of liver (i) in the indicated group. Quantitative data (j) were analyzed by total photon flux (p/s) on metastatic liver. p values were represented by ANOVA analysis. ***p < 0.001. k Representative H&E images (left) and IHC (right) stained for KIT in the tumor sections collected from spleens and livers. Scale bars, 100 µm.

