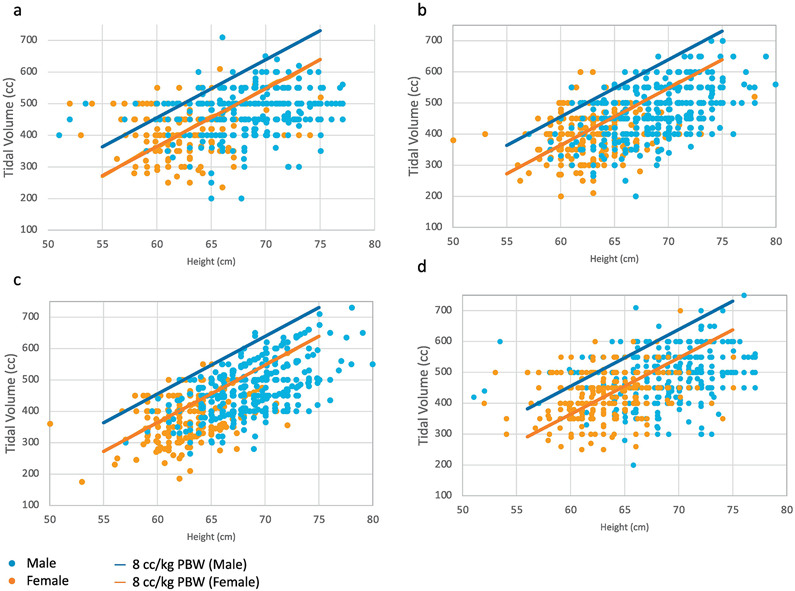
Figure 3: Tidal volumes plotted by height in control and adoption cohorts.

Each individual dot represents the initial tidal volume (Vt) in cubic centimeters (cc) for a unique patient plotted against the patient’s height in centimeters. Women are represented in orange, and men are represented in blue. The orange and blue lines indicate 8cc/kg of predicted body weight (PBW) for women and men respectively. Adherence to lung protective ventilation (LPV) is below these lines. Panel 3a depicts ordered Vt in the control cohort, 3b depicts delivered Vt in the control cohort. Panel 3c depicts ordered Vt in the adoption cohort and 3d depicts delivered Vt in the adoption cohort.
