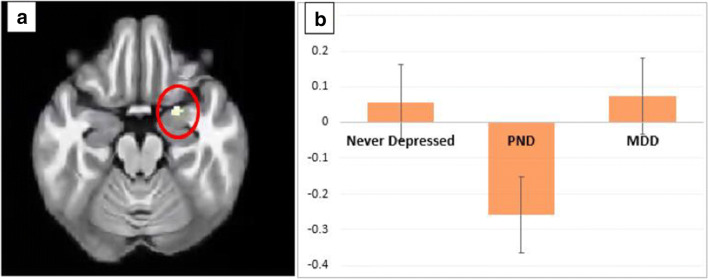
Fig. 1.
Group differences during an fMRI task when looking at happy faces compared to neutral faces. a Region of interest analysis: decrease in activation in the right amygdala in the past postnatal depression group (PND) compared to the past major depressive disorder (MDD) group (p = 0.044). There were no significant differences observed between the other groups. b Plot of mean blood oxygenation level–dependent (BOLD) signal in the right amygdala cluster with peak at coordinates at 24 4–20 (never depressed, past postnatal depression group (PND), past major depressive disorder group (MDD))

