Fig. 1.
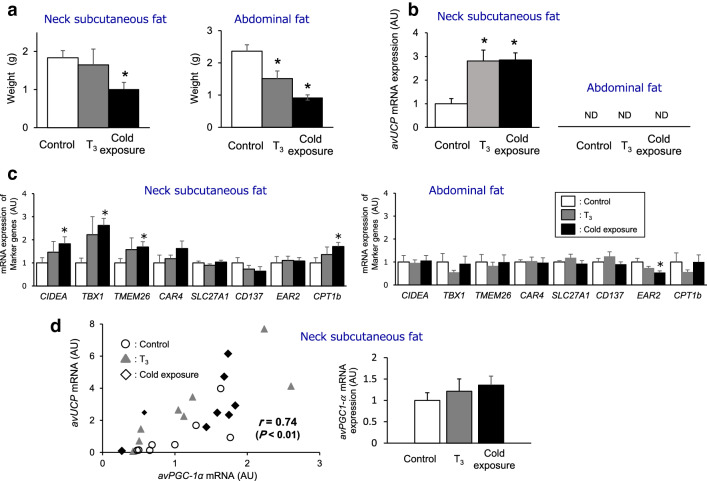
Increased mRNA expression levels of avian UCP (avUCP) and of beige adipose tissue markers in chickens exposed to 4 °C or fed a T3-supplemented diet. a Weights of neck subcutaneous fat (left) and abdominal fat (right) of control, T3-treated and cold-exposed chickens. Values are means ± S.E., n = 8 chickens in each group. b mRNA levels of avUCP in neck subcutaneous fat (left) and abdominal fat (right) of control, T3-treated and cold-exposed chickens. Values are means ± S.E., n = 8 chickens in each group. c mRNA levels of markers known to be enriched in mammalian beige adipocytes in neck subcutaneous fat (left) and abdominal fat (right) of control, T3-treated and cold-exposed chickens. Values are means ± S.E., n = 8 chickens for CIDEA, TBX1 and TMEM26 in each group; n = 5–8 chickens for CAR4, SLC27A1, CD137, EAR2 and CPT1b in each group. d Dependency of avUCP expression on avPGC-1α in neck subcutaneous fat of control, T3-treated, and cold-exposed chickens (n = 24) and effects of T3- and cold-treatments on mRNA levels of avPGC-1α. (n = 8 chickens in each group). All data for mRNA levels are shown as fold changes relative to control values. Quantitative real-time RT-PCR was used to quantify mRNA levels, and the results were normalized to 18S mRNA levels. ND means not appropriately detected for too low expression. Value in panel D represents Pearson correlation coefficient for the relationship between avUCP and PGC-1α gene levels. Differences between control, T3- and cold-treated groups were assessed using the Shirley-Williams test. *p < 0.05 compared to the control group

