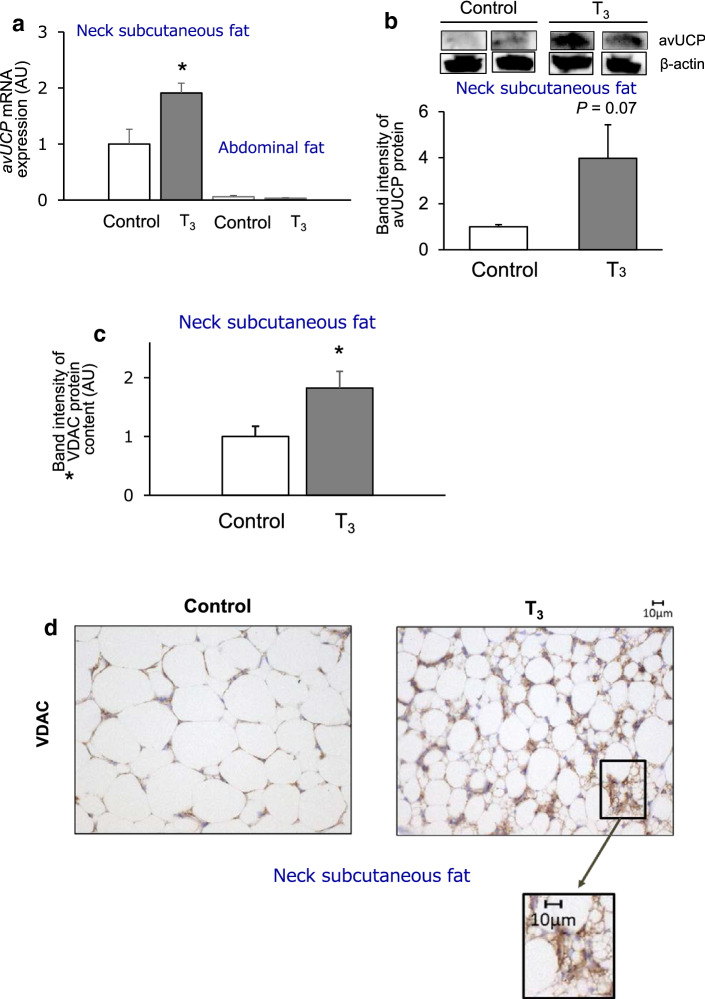
Fig. 3.
Clusters of beige-like adipocytes densely emerge in a mitochondria-rich cell of neck subcutaneous fat in T3-treated chickens. a mRNA levels of avUCP in neck subcutaneous fat and abdominal fat tissues of control and T3-treated chickens. Quantitative real-time RT-PCR was used to quantify mRNA levels, and the results were normalized to 18S rRNA levels. Values are means ± S.E., n = 5–6 chickens in each group. b Protein levels of avUCP in neck subcutaneous fat of control and T3-treated chickens. avUCP protein levels were assessed by Western blot of tissue protein (80 μg) using an anti-avUCP antibody. Band intensities of avUCP shown as semi-quantified by densitometric tracing. Values are means ± S.E., n = 5 chickens in each group. Uncropped data and observed band size are depicted in Supplement A, Supporting Information. c VDAC protein content in neck subcutaneous fat of control and T3-treated chickens. VDAC protein levels were assessed by Western blot analysis of tissue protein (10 μg) using an anti-VDAC antibody. Band intensities of VDAC shown as semi-quantified by densitometric tracing. Values are means ± S.E., n = 6 chickens in each group. Uncropped data are depicted in Supplement B, Supporting Information. d Immunohistochemical analysis using anti-VDAC antibody for neck subcutaneous fat of control and T3-treated chickens. Data for mRNA and protein levels of avUCP or VDAC protein are shown as fold changes relative to control values for the neck subcutaneous fat. Differences between control and T3-treated chickens were assessed using the Student’s t-test for unpaired data. *p < 0.05 compared to the control group

