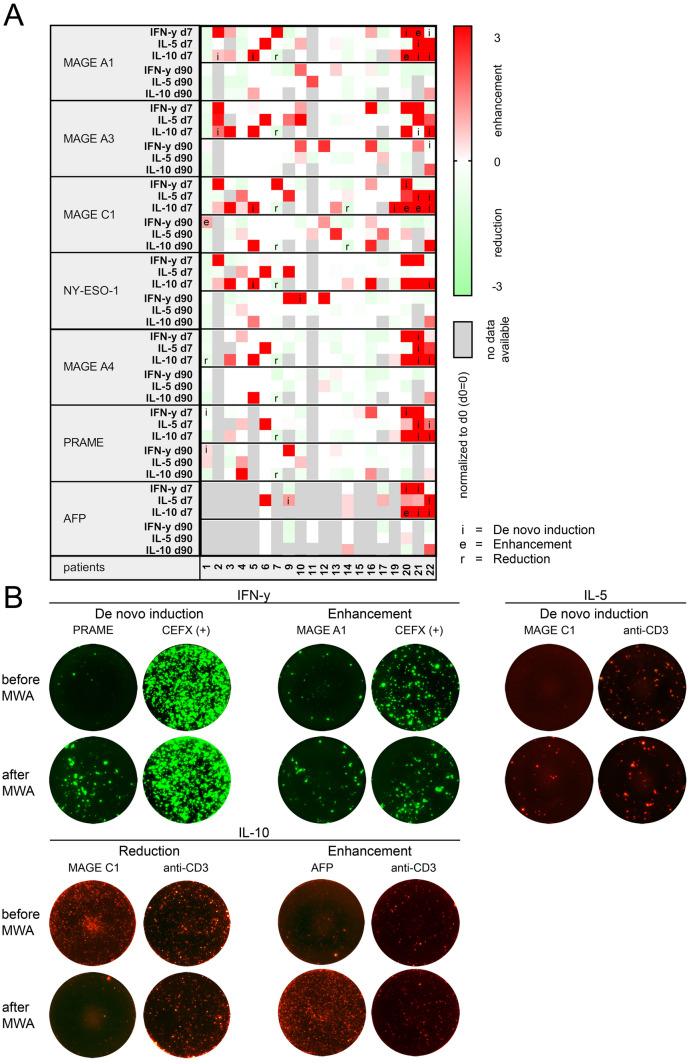
Fig. 2.
Analysis of the tumor antigen-specific T cell response by Fluorospot analysis: a Heatmap showing an overview of immune responses against HCC-specific tumor antigens (MAGE-A1, MAGE-A3, MAGE-C1, NY-ESO-1, MAGE-A4, PRAME, AFP) after MWA (d7, d90) normalized to specific spots obtained from PBMC on d0 (specific spots d0 = 0) (n = 20), pointing out significant de novo inductions (i) and enhancements (e) of IFN-y, IL-5 or IL-10 response and significant reductions (r) of IL-10 production. b Exemplary Fluorospot analysis of de novo induction of IFN-y response against PRAME (patient 20), enhancement of IFN-y response against MAGE-A1 (patient 21), De-novo induction of IL-5 response against CTA MAGE C1 (patient 21), reduction of IL-10 response against CTA MAGE C1 (patient 14), enhancement of IL-10 response against tumor antigen AFP (patient 20). Positive controls (CEFX for IFN-y, anti-CD3 for IL-5 and IL-10) for each patient are depicted on the right

