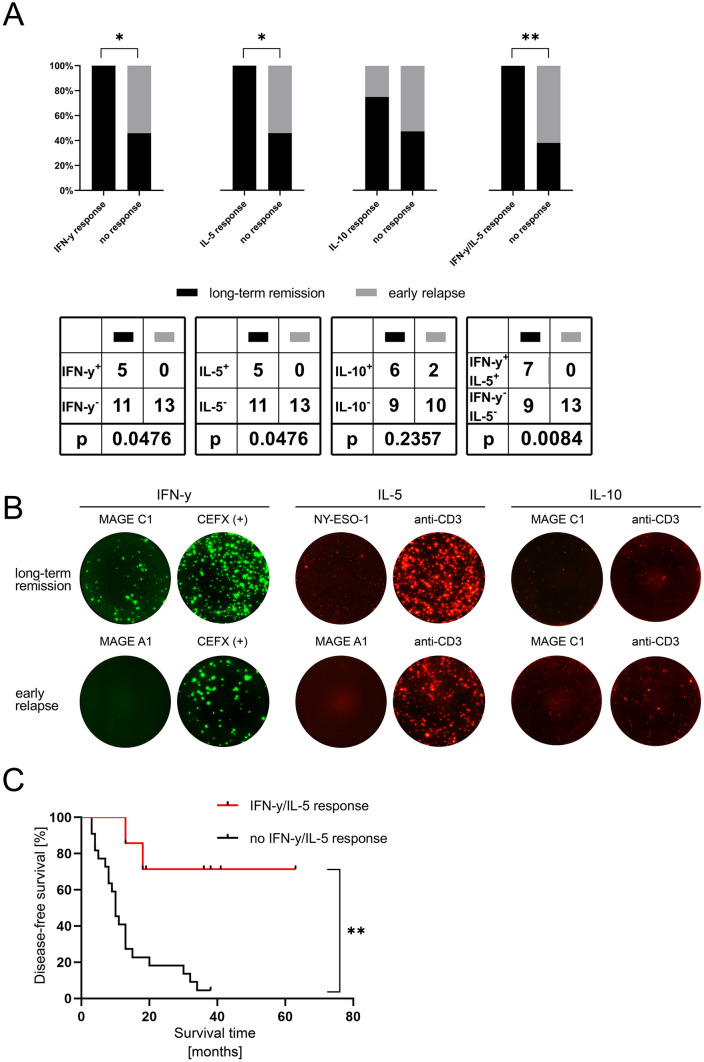
Fig. 4.
Analysis of the tumor antigen-specific T cell response by Fluorospot analysis: a comparison of the presence of tumor antigen-specific IFN-y, IL-5, IL-10 response after MWA in the two retrospective cohorts (n = 29). Panels show the percentage and absolute number of patients with TAA-specific cytokine response. b Exemplary Fluorospot analysis of IFN-y response against MAGE-A1 (long-term remission patient 2) and MAGE-C1 (relapsed patient 11), IL-5 response against NY-ESO-1 (long-term remission patient 2) and MAGE-A1 (relapsed patient 11) and IL-10 response against MAGE C1 (long-term remission patient 3) and MAGE C1 (relapsed patient 11). Positive controls (CEFX (+) for IFN-y or anti-CD3 for IL-5 and IL-10) for each patient are depicted on the right. c Kaplan Meyer analysis of disease-free survival of all retrospective patients (n = 29) depending on the presence of either IFN-y or IL-5 response against any CTA

