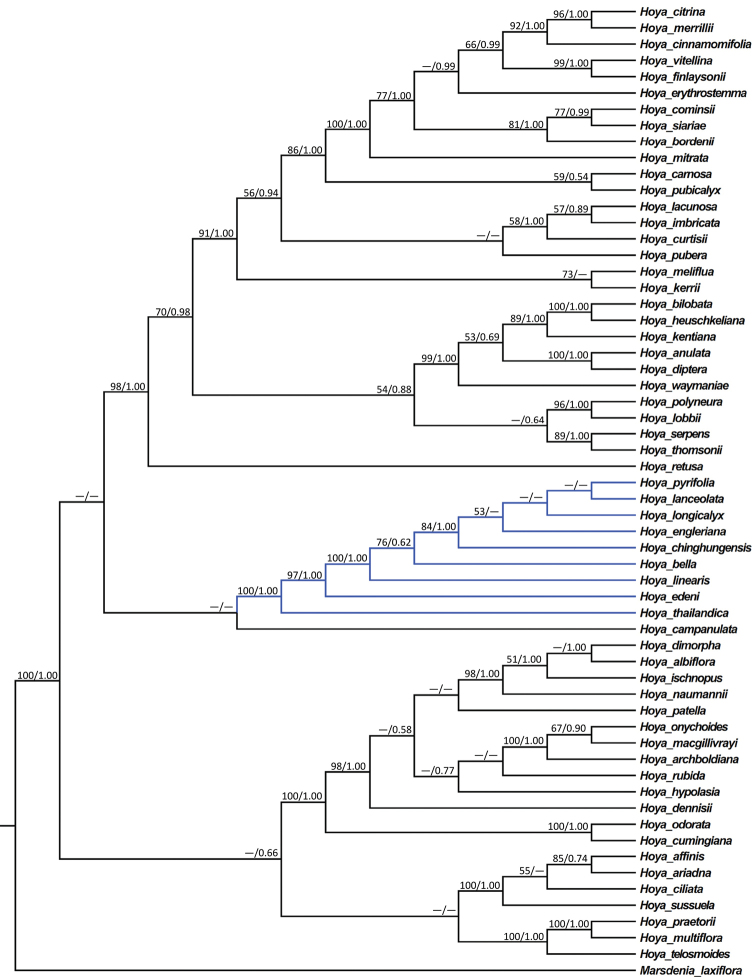
Figure 2.
Maximum Likelihood (ML) tree of Hoya species inferred from the combined dataset of five DNA regions (ETS, ITS, matK, psbA-trnH and trnT-trnL). Bootstrap (BS) values ≥ 50% in ML analysis and posterior probability (PP) ≥ 0.50 in Bayesian Inference (BI) are indicated on the left and right of slanting bars above a phylogenetic node, respectively. Dashes denote that the phylogenetic node was not supported, the BS value is < 50% in the ML analysis or PP < 0.50 in the BI analysis.

