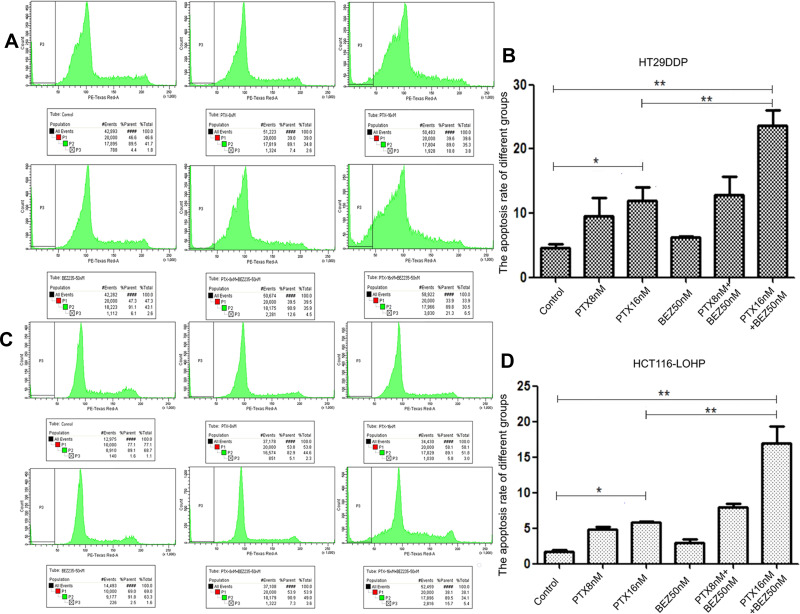
Figure 5.
Apoptosis analysis by sub-G1/G0 population with PI staining. After different treatments with PTX and BEZ235 in HT29DDP (A and B) and HCT116-LOHP (C and D) cancer cells, different degrees of apoptosis were observed. Graph a and c show the apoptotic sub-G1/G0 (P3) populations. Graphs c and d show the summary of 3 individual assays.
Notes: *P < 0.05, **P < 0.01.

