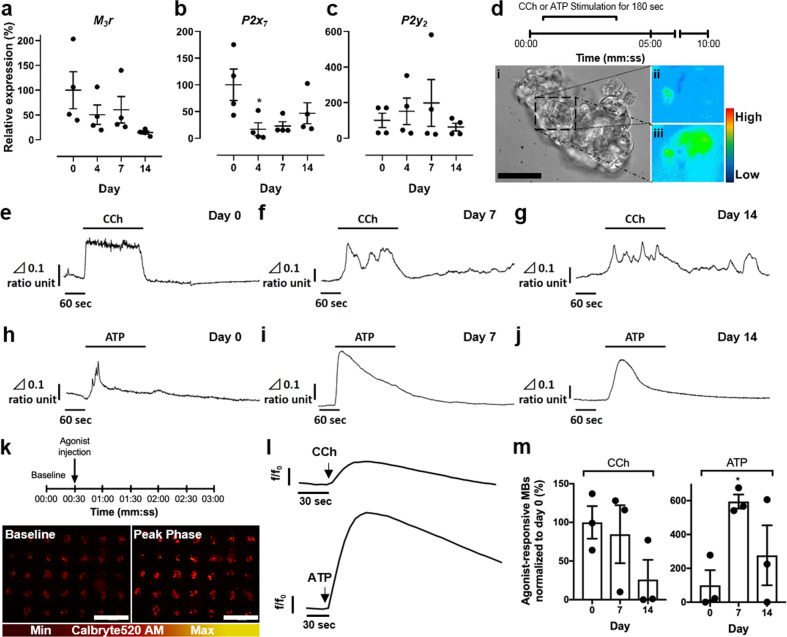
Fig. 4. Mouse SGm in MB-hydrogels are responsive to stimulation with muscarinic agonist carbachol (CCh) and purinergic agonist ATP.
a–c Gene expression profiles of muscarinic receptor type 3 (M3r: a) and purinergic receptors (P2x7: b and P2y2: c) in freshly isolated mouse salivary gland tissue and SGm at days 4, 7, and 14. d Experimental time-course of calcium imaging on mouse SGm using Fura-2 AM: fluorescent imaging was initiated at time 0 with continuous perfusion of buffer. CCh was then perfused for 180 s. After perfusion of buffer for 10 min, ATP was perfused for 180 s. Images of SGm at day 7: brightfield (d: i); baseline fluorescent intensity of [Ca2+]i (d: ii) and peak phase fluorescence of [Ca2+]i after stimulation with CCh (d: iii). Pseudocolor bar indicates relative intensity of Δ340/380 ratio. Δ0.1 ratio unit equals 340/380 ratio = 0.1. Scale bar = 50 μm. e–g CCh stimulation leads to an elevation of [Ca2+]i at day 0 (e) and in SGm (day 7: f, day 14: g). h–j Changes in [Ca2+]i in AIDUCs (h) and in SGm (at day 7: i, day 14: j) are generated by stimulation with ATP. Vertical bar shows Δ340/380 ratio unit, and horizontal bar indicates time unit. k–m Ca2+ signaling assay of SGm in whole tissue chips. k Experimental timeline of fluorescent imaging of Ca2+-binding indicator Calbryte520 AM: baseline signals were collected in buffer from time 0, and CCh or ATP were injected at 30 s. l Representative fluorescent traces of responsive SGm at day 7 upon CCh and ATP stimulation. Data are represented as fluorescent intensity (f) divided by fluorescence at time 0 (fo). m Percent of SGm in MBs responsive to CCh and ATP. Response is characterized by a significant difference between baseline timepoints and agonist timepoints via unpaired t-tests corrected for multiple comparisons using Holm–Sidak with α = 0.05. Data is graphed and normalized to day 0 as 100%. Data showed mean ± SEM, N ≥ 3, n = 85–97 per timepoint. **p < 0.01, *p < 0.05.

