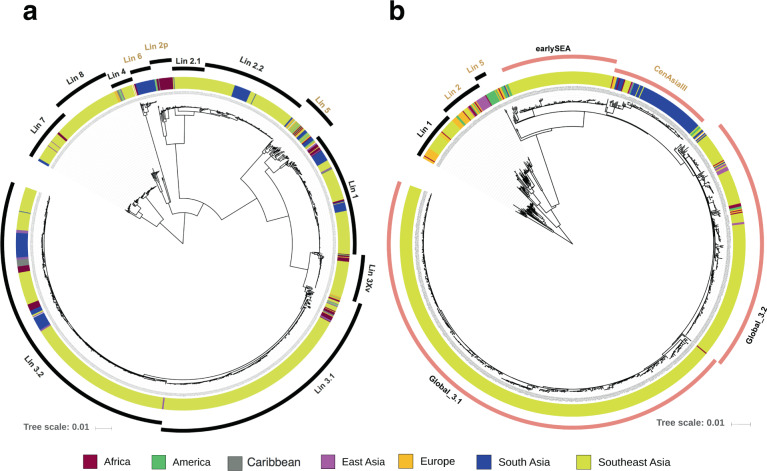
Fig. 2. The global phylogenetic structure of Shigella flexneri and Shigella sonnei.
a The maximum likelihood phylogeny of 1323 S. flexneri isolates, compiled from those sequenced for this study and a previously published study on S. flexneri global diversity (ref. 10). Different lineages were identified based on Bayesian Analysis of Population Structure hierarchical clustering (hierBAPS) and were named in accordance to the nomenclatures defined in ref. 10 (Lineages 1–7), with Lineage 8 newly defined in this study. The tree is rooted using Lineages 7 and 8 (see Methods). b The maximum likelihood phylogeny of 993 S. sonnei isolates, compiled from those sequenced for this study and previously published studies on S. sonnei global diversity (ref. 8), S. sonnei local evolution in Vietnam (ref. 9), and S. sonnei local evolution in Bhutan (ref. 34). The isolates are grouped into lineages defined previously in the global diversity study (ref. 8), and the tree is rooted using Lineage 1. For both (a) and (b), the colours of the inner ring indicate the isolate’s geographical source (see key) while the outer ring defines the lineage clustering (with S. sonnei Lineage 3’s sub-lineages coloured in pink). Lineages that do not contain substantial numbers of Southeast Asian sequences are labelled in orange and excluded from downstream analyses. The horizontal scale bar shows the number of nucleotide substitutions per site.

