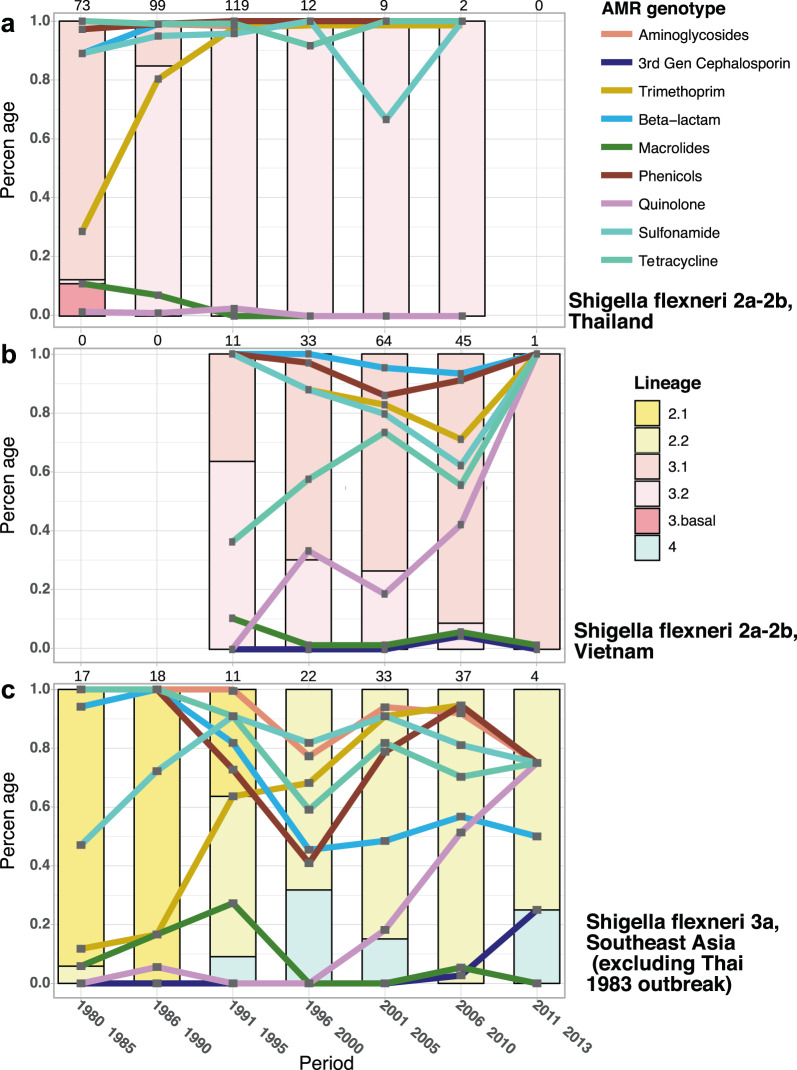
Fig. 4. Clonal replacement of Shigella flexneri in Southeast Asia.
The figures display the isolation frequency of major S. flexneri lineages from 1980 to 2013, specifically for (a) serotypes 2 (2a, 2b) from all regions of Thailand, (b) serotypes 2 (2a, 2b) from all regions of Vietnam, and (c) serotype 3a from all countries across Southeast Asia (Thailand, Vietnam, Cambodia, Laos), excluding 11 Lin-2.2 isolates of a presumptive outbreak in Thailand in 1983 (see Method). The bar charts display the proportional sampling of these populations compared with the total S. flexneri of the respective serotype isolated during a period (total number of isolates indicated on top of each bar). The percentage of S. flexneri isolates resistant to a given antimicrobial, determined by identification of AMR genetic factors, is plotted by line graph. The y-axis (percentage) is used to measure both the isolation proportion of S. flexneri populations and proportion with resistance to specified antimicrobials.

