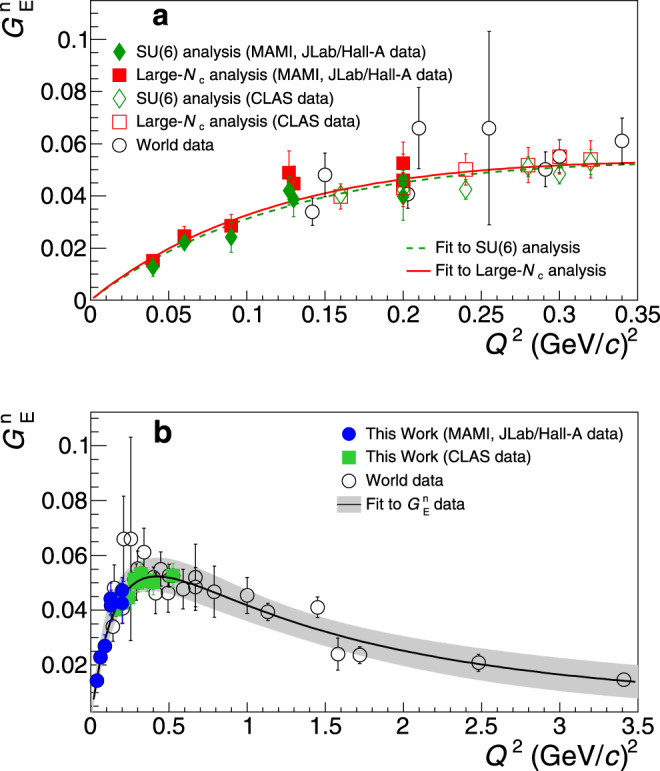
Fig. 3. The neutron electric form factor.

a Green diamonds: the neutron electric form factor, , at low momentum transfers from the analysis based on the SU(6)22 and nb determined from the world data. Red boxes: the results from the analysis based on the large-Nc23. The fit to the data from the parametrization of Eq. (5) is shown with the dashed and the solid curves, respectively. The filled symbols (diamonds/boxes) correspond to the analysis of the data from ref. 24–28 (MAMI, JLab/Hall-A data) and the open ones to that of ref. 31 (CLAS data). b Blue circles: the final results at low momentum transfers, extracted from the weighted average of the SU(6) and the large-Nc analysis results. The variance of the two data sets is quantified as a theoretical uncertainty. The solid curve shows the fit to the data from the parametrization of Eq. (5), with its uncertainty (shaded band). The world data (open-circles)7–21 are shown. The extracted from the analysis of the CLAS measurements31 at intermediate momentum transfers is also shown (green boxes). The error bars correspond to the total uncertainty, at the 1σ or 68% confidence level.
