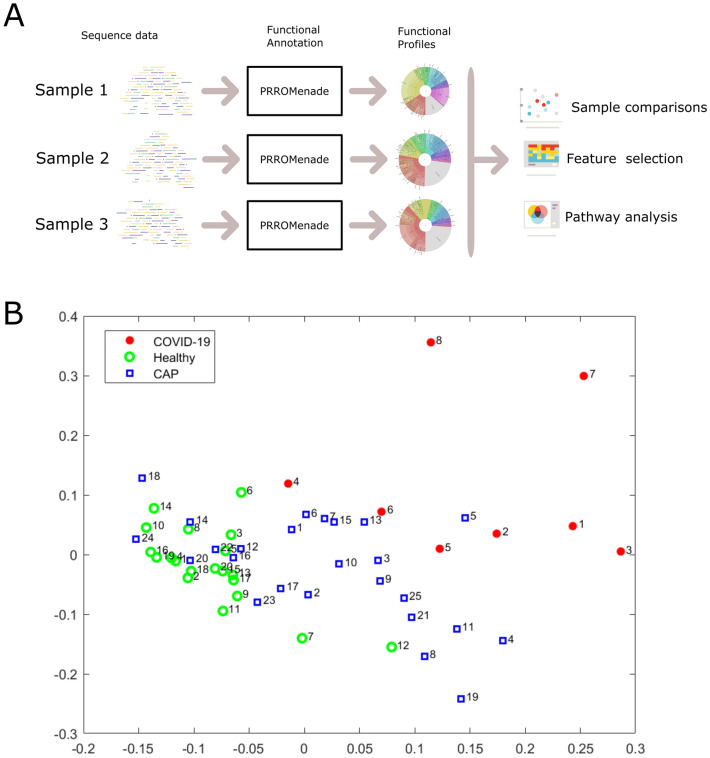
Figure 1.
Overall analysis workflow and two-dimensional projection of functional profiles. (A). Each microbiome sequencing sample is annotated with PRROMenade, utilizing labeled reference data from the IBM Functional Genomic Platform. The resulting functional profiles are visualized and compared in downstream analyses. (B). Multidimensional scaling of the functional profiles using the Spearman distance. Each sample is represented by a marker colored by cohort and labeled by the sample number within that cohort.

