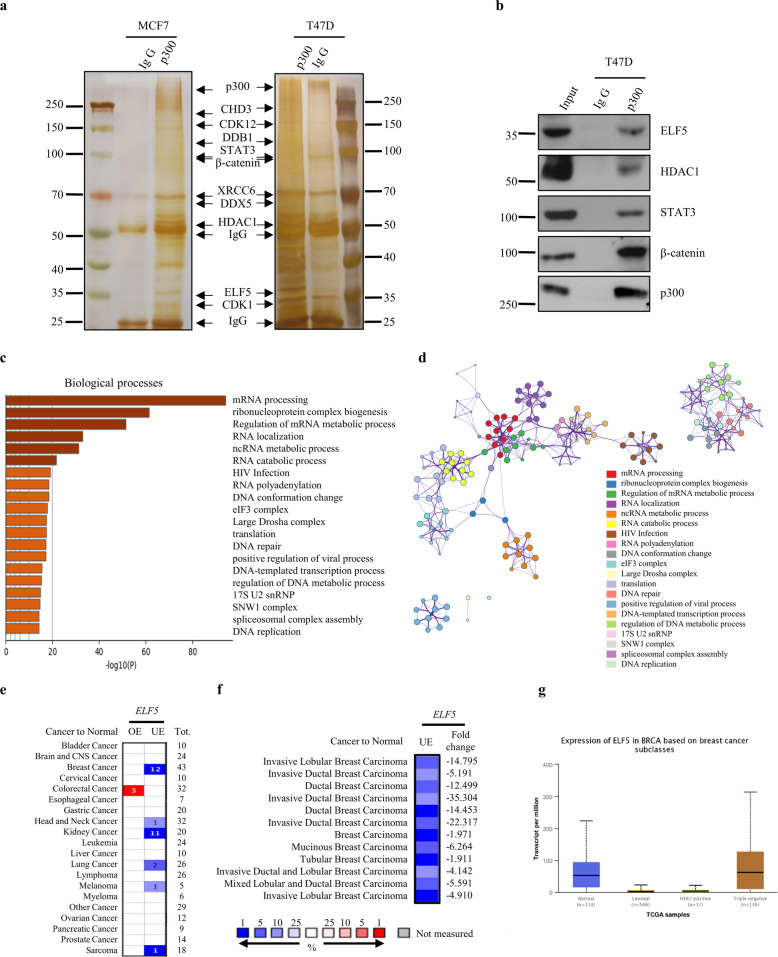
Fig. 1. Identification of ELF5 from p300 interaction network.
a Silver-staining of p300 interacted protein. MCF7 cell lysis and T47D cell lysis were prepared and subjected to affinity purification using anti-p300 antibody or normal IgG. The purified proteins were resolved by SDS-PAGE and visualized by silver-staining. The protein bands were excised and analyzed by mass spectrometry. b ELF5 was immunoprecipitated with p300. Whole-cell lysates from T47D cells were subjected to co-immunoprecipitation performed with anti-p300 antibody or normal IgG followed by immunoblotting with performed with the indicated antibodies. Enrichment analysis (c) and cluster analysis (d) of biological processes according to the results of mass spectrometry. The graphs were downloaded from http://metascape.org/. e, f Comparison of ELF5 mRNA expression in healthy and various cancer tissues. Patients datasets were retrieved from the Oncomine database. OE: over-expressed, UE: under-expressed, Tot: total unique analyses. Numbers of significant analyses (p < 0.05; fold change >1.5) are shown inside the boxes and total numbers on the right side. Cell color indicates the best gene rank percentile for the analyses (red: over-expressed; blue: under-expressed). ELF5 mRNA expression as in Fig. 1e. Breast cancer datasets from Fig. 1e were displayed in details in Fig. 1f. g The expression of ELF5 in breast cancer based on breast cancer subclasses and data from http://ualcan.path.uab.edu/.

