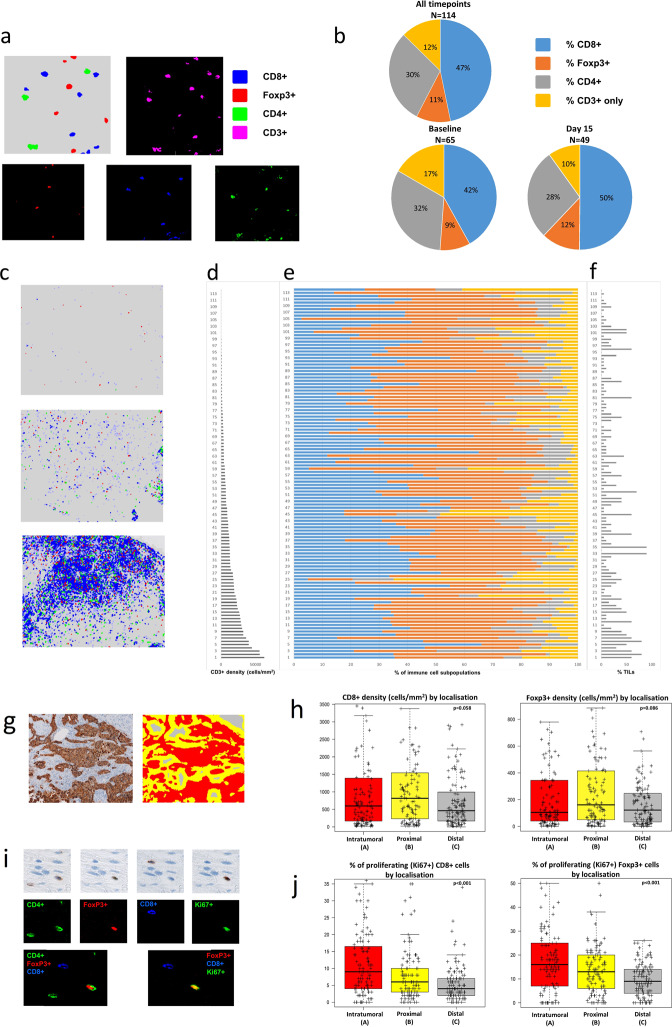
Fig. 2. Multiplexed spatial cellular phenotyping of breast cancer.
a Representative example of the analytical pipeline classifying immune cells (top left) and colour deconvoluted images with red, green and blue colours assigned to Foxp3+, CD4+ and CD8+, respectively (bottom) and magenta for CD3+ (top right). Images at 25×. b Proportions of CD3+ immune subsets across all patients’ samples (up), baseline samples (down to the left) and day 15 samples (down to the right). CD8+, Foxp3+, CD4+ and CD3+-only in blue, orange, gray and yellow. c Representative examples of breast cancers with low (up), medium (middle) and high (down) T-cell densities. Images at 5×. d CD3+ density results across the entire population of HER2+ breast cancers. Samples are ordered from lowest to highest. e Proportions of CD8+ (blue), Foxp3+ (orange), CD4+ (gray) and CD3+ only (yellow) cells for all patients’ samples. f Stromal tumour-infiltrating lymphocytes (TILs) in breast cancer samples with available NGI data. g Representative example of the spatial analysis areas defined by the image analysis algorithm using cytokeratin as tumour mask. Intratumoural (a, in red), proximal peritumoural stroma within 30 µm (b, in yellow) and distal peritumoural stroma >30 µm from the tumour (c, in gray) regions are shown. Images at 5×. h Boxplots of immune cells densities (CD8+ and Foxp3+) according to spatial location. Boxplot legend: centre line: median; bounds of box: interquartile range (IQR); whiskers: highest and lowest value excluding outliers (Q3 + 1.5*IQR to Q1 − 1.5*IQR); markers beyond the whiskers: potential outliers. i Representative example of CD4+, Foxp3+, CD8+ and KI67+ sequential immunohistochemistry and co-expression analyses for T cells activity assessment on the same tissue slide (top panel). The colour green, red, blue and green is assigned, respectively, to each individual staining for visualisation purpose, co-expression analyses and virtually multiplexed images (first image composed by CD4, Foxp3 and CD8 and second image composed by Foxp3, CD8 and Ki67; co-expression in yellow). Images at 50×. j Boxplots of the proportion of proliferating immune cells (CD8+ and Foxp3+) according to spatial location. Boxplot legend: centre line: median; bounds of box: interquartile range (IQR); whiskers: highest and lowest value excluding outliers (Q3 + 1.5*IQR to Q1 − 1.5*IQR); markers beyond the whiskers: potential outliers.

