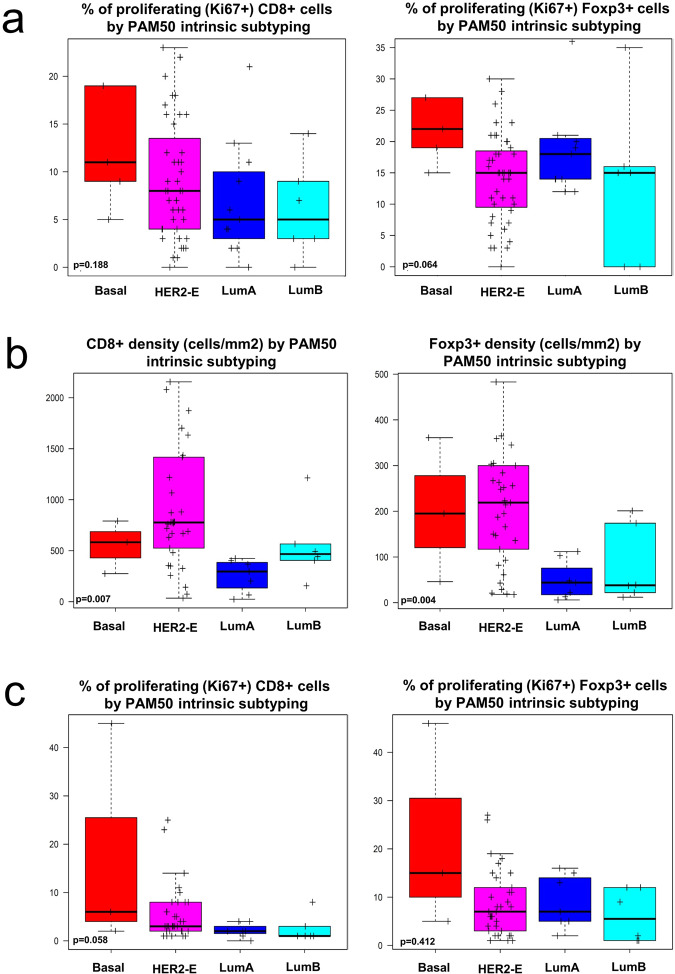
Fig. 3. Immune cell density according to intrinsic subtype.
a Boxplots of the proportion of proliferating immune cells (CD8+ and Foxp3+) at baseline according to baseline intrinsic subtyping. b Boxplots of immune cells densities (CD8+ and Foxp3+) at day 15 according to baseline intrinsic subtyping. c Boxplots of the proportion of proliferating immune cells (CD8+ and Foxp3+) at day 15 according to baseline intrinsic subtyping. Boxplot legend: centre line: median; bounds of box: interquartile range (IQR); whiskers: highest and lowest value excluding outliers (Q3 + 1.5*IQR to Q1 – 1.5*IQR); markers beyond the whiskers: potential outliers.

