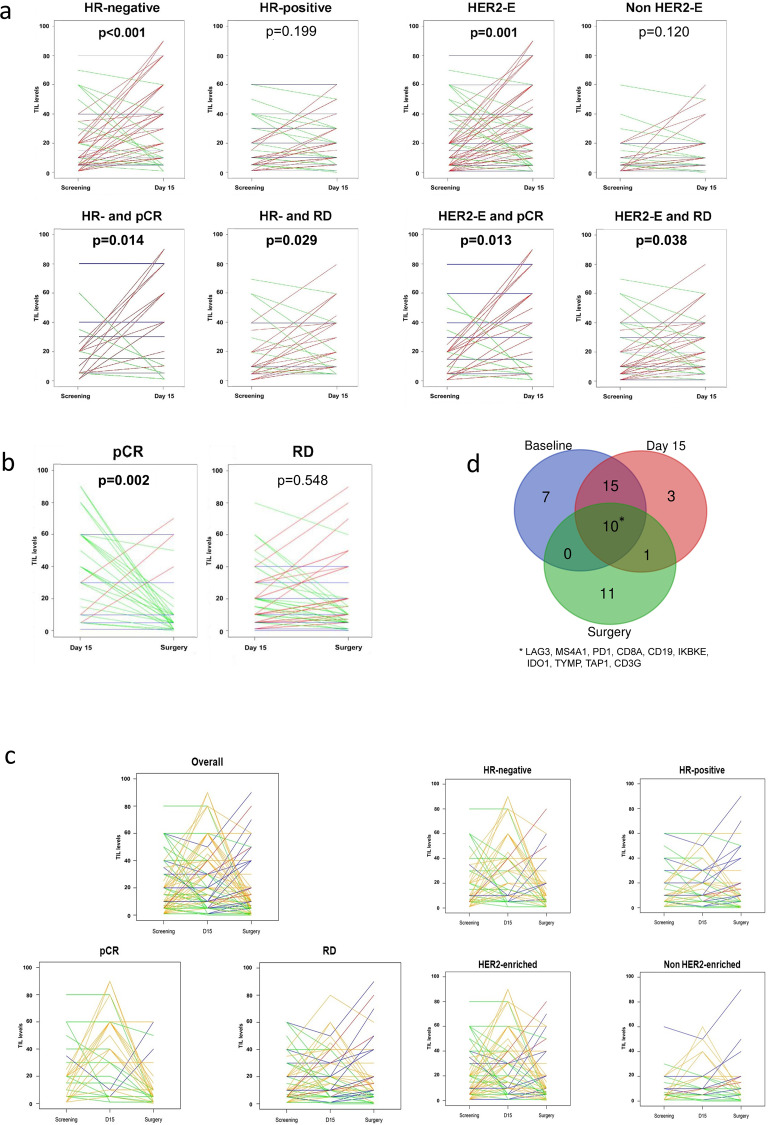
Fig. 4. Changes in sTILs across timepoints and correlation with gene expression.
a Changes in TILs between baseline and day 15 according to hormone receptor [HR] status, subtype (HER2-enriched [HER2-E]) and response (pathological complete response [pCR] vs residual disease [RD]). Lines are coloured according to TIL dynamics: increase (red), stable (blue) or decrease (green). b Changes in TIL levels between day 15 and surgery according to response: pathological complete response [pCR] vs residual disease [RD]. Lines are coloured according to TIL dynamics: increase (red), stable (blue), or decrease (green). c Changes in TIL levels between baseline, day 15 and surgery in the overall study cohort and according to response (pathological complete response [pCR] vs residual disease [RD]), hormone receptor [HR] status and PAM50 subtype. Lines are coloured according to TIL dynamics: increase between baseline and day 15 followed by an increase between day 15 and surgery (red); increase between baseline and day 15 followed by stable or decrease between day 15 and surgery (orange); stable or decrease between baseline and day 15 followed by an increase between day 15 and surgery (blue); stable or decrease between baseline and day 15 followed by stable or decrease between day 15 and surgery (green). d Venn diagram representing overlaps in genes upregulated in relation to increase in TIL levels across the three timepoints.

