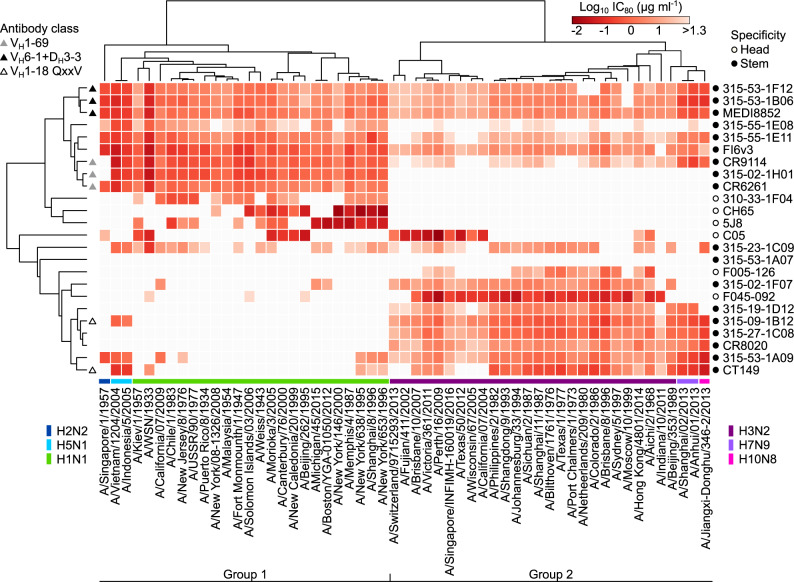
Fig. 5. In-depth neutralization profiling of influenza monoclonal antibodies.
Heatmap of neutralization titers (IC80 μg ml−1) of 24 monoclonal antibodies against a panel of 55 R3 influenza A viruses. Virus subtypes are color-coded and indicated at the bottom of the heatmap. Open and closed circles indicate specificity of monoclonal antibodies and are shown on the right of the heatmap (open, HA head-; closed, HA stem-directed). Convergent classes of bnAbs with specific gene signatures are indicated on the left of the heatmap as triangles (gray, VH1-69; black, VH6-1 + DH3-3; open, VH1-18 QxxV). Heatmap and unsupervised clustering was made with the ClustVis server (https://biit.cs.ut.ee/clustvis/). Note: H1N1 and H3N2 viruses are R3∆PB1 and all other viral subtypes are R3∆HA viruses. Neutralization assays were performed at least twice and representative data are plotted.

