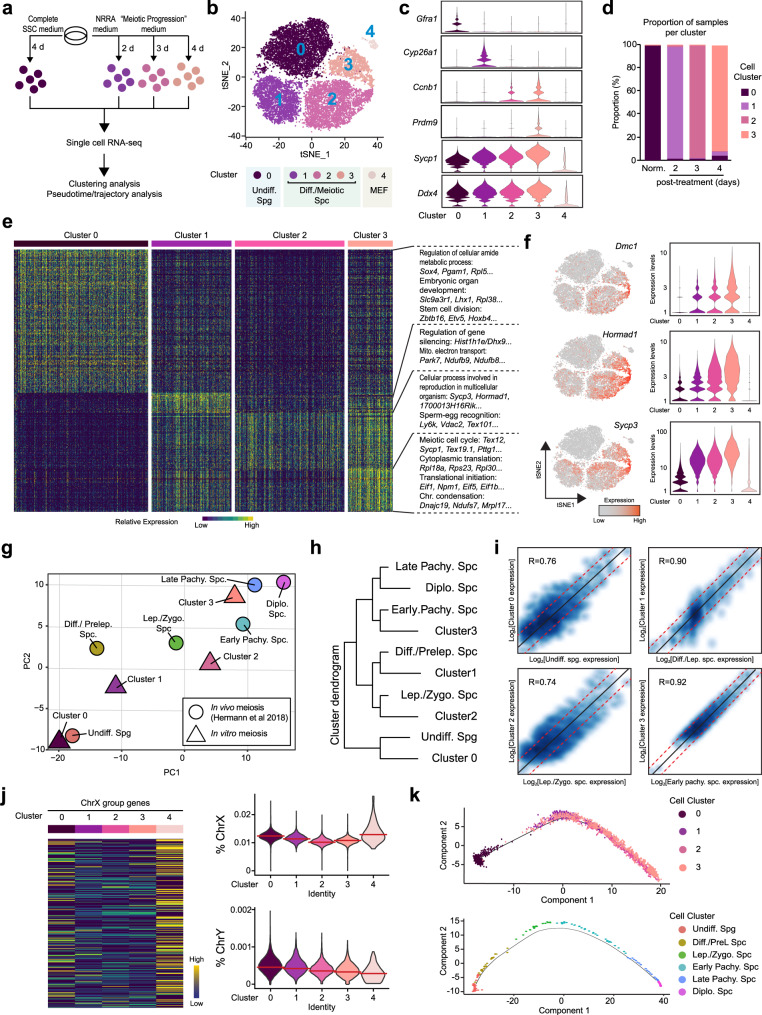
Fig. 2. scRNA-seq analysis of SSC culture during NRRA-induced meiotic initiation and progression.
a Workflow of scRNA-seq experiment. Number of cells collected: 6884 (0 day), 6936 (2 day), 6200 (3 day), and 5587 (4 day). b A t-distributed Stochastic Neighbor Embedding (tSNE) plot for analyzed cells. Cluster 0–3 were germ cells and Cluster 4 was somatic cells. Number of cells selected for analysis: Cluster 0 (6487 cells), Cluster 1 (5286 cells), Cluster 2 (3860 cells), Cluster 3 (2170 cells), and Cluster 4 (285 cells). c Violin plots showing the expression level of representative genes in each cluster. d A bar plot showing the proportion of the different cell clusters at different time points. e A heatmap showing the expression of marker genes and GO functions in each cluster. f Gene expression patterns of indicated genes on tSNE plots and violin plots. Expression levels are calculated by UMI counts. g PCA analysis showing the relationship between single-cell clusters from NRRA-treated culture in vitro (n = 4 clusters) and early mouse spermatogenesis in vivo (n = 6 clusters) based on the transcriptional profiles of commonly expressed genes (n = 7803 genes). h Hierarchical clustering showing the relationship between single-cell clusters from NRRA-treated culture in vitro and early mouse spermatogenesis in vivo. “NR/RA-upregulated” indicates genes that were upregulated by NR or RA. “NRRA-upregulated” indicates that were upregulated by NRRA (not upregulated by NR or RA alone). i Scatter plots comparing marker genes expression profile between in vitro clusters and in vivo clusters. j (Left) Heatmap of sex chromosome genes in Clusters 0–3. (Right) Violin plots showing percentage of X and Y chromosome genes profiles in Clusters 0–3. The median is shown by a red line. k Scatter plots showing cells along the projected pseudo-time in Cluster 0–3 (upper) and in indicated clusters from early mouse spermatogenesis in vivo (lower).

