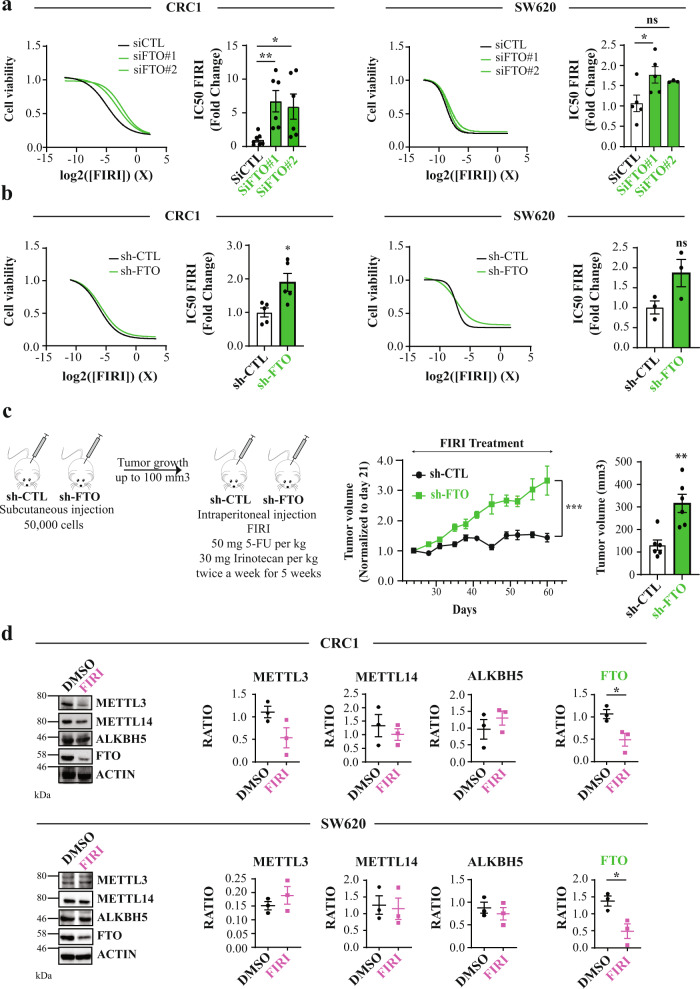
Fig. 2. FTO silencing confers resistance to chemotherapy.
a Transient FTO silencing increases chemoresistance to FIRI. Graphs illustration of FIRI toxicity on either si-FTO or si-CTL-transfected cells (CRC1 (left) and SW620 (right) cell lines). Toxicity was measured using Sulforhodamine B assay. Bar plot represents quantification of IC50 of at least five biological replicates. FIRI 1 X = 50 µM 5-FU, 0.5 µM SN38. Mean ± S.E.M, **p-value < 0.01, *p-value < 0.05, Two-sided unpaired T-test. b Stable FTO silencing increases chemoresistance to FIRI. Same as a with stable cell lines (sh-FTO or sh-CTL) from two distinct backgrounds (CRC1 (left) and SW620 (right)). Mean ± S.E.M, *p-value < 0.05, ns not significant, Two-sided unpaired T-test. c FTO silencing increases in vivo chemoresistance. Fifty-thousand of either sh-FTO or sh-CTL cells were subcutaneously injected into the flank of nude mice. After 21 days (tumor size about 100mm3), mice were treated with FIRI (50 mg FIRI per kg, 30 mg irinotecan per kg) and tumor growth was measured twice a week for 5 weeks. ***p-value < 0.001, two-way ANOVA test. Bar plot represent mean ± S.E.M of tumor volume measured at the last time point. **p-value < 0.01, Two-sided unpaired T-test. d FIRI-resistant cells display decreased FTO expression. Immunoblot analysis of METTL3–METTL14, ALKBH5 and FTO levels after 72 h of 0.2× FIRI treatment. Pictures are representative of three experiments in CRC1 cell line. Protein level quantification is mean ± S.E.M of FTO normalized to ACTIN of three biological replicates. *p-value < 0.05, ns not significant, Two-sided unpaired T-test.

