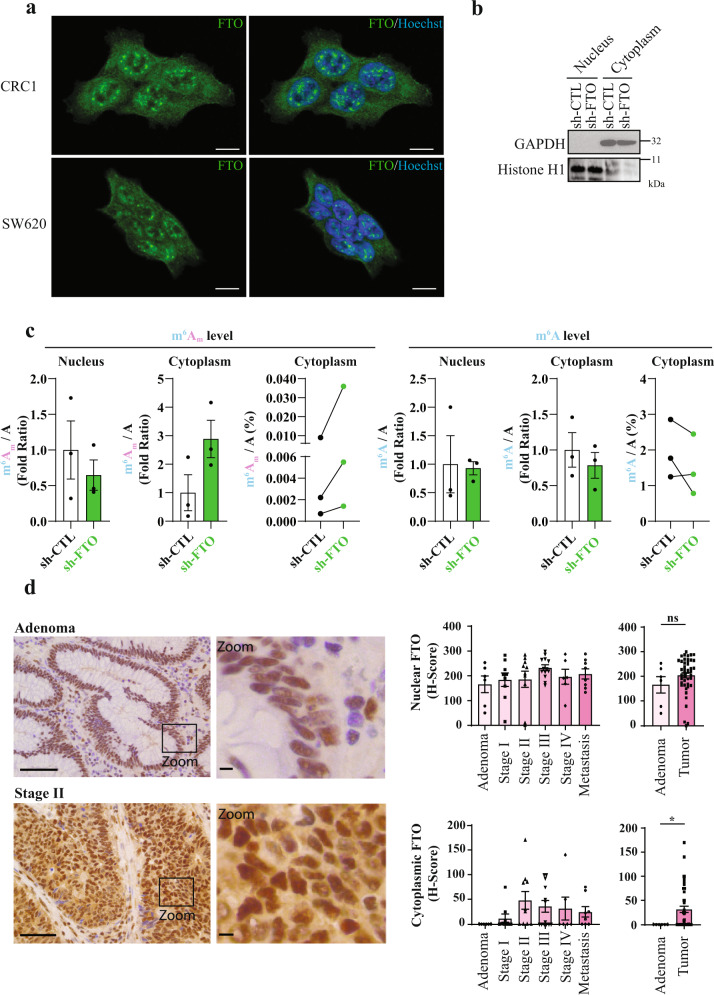
Fig. 5. FTO mediated m6Am demethylation takes place in the cytoplasm.
a FTO localizes both in nucleus and cytoplasm. Immunofluorescence staining of FTO (green) in CRC1 and SW620 cell lines show presence of FTO in cytoplasm and in nuclear speckles. Nucleus of cells were stained with Hoechst (blue). Pictures are representative of several fields and two biological experiments. Scale bar 10 μm. b Verification of the effective cell fractionation procedure by immunoblot. Effective separation of cytoplasmic and nuclear fractions was evaluated by immunoblot using cytoplasmic marker (GAPDH) and nuclear marker (Histone H1). c FTO silencing increases cytoplasmic m6Am level. mRNA quantification of m6Am/A and m6A/A level for nuclear fraction and cytoplasmic fraction. Bar plots represents mean ± S.E.M of three biological replicates. Before–After plots represents the same data as bar plot with raw values. d FTO relocalizes to the cytoplasm during tumorigenesis. FTO expression and localization was evaluated by IHC on TMA from CRC patient. Then, nuclear and cytoplasmic level of FTO were quantified. Pictures are representative of stage 0 and stage 2. Scale bars 100 µm and 10 µm (zoom). Bar plots represents mean ± S.E.M of H-score based on nuclear and cytoplasmic intensity of FTO staining. Each dot corresponds to individual value. *p-value < 0.05, ns not significant, two-tailed Mann–Whitney test.

