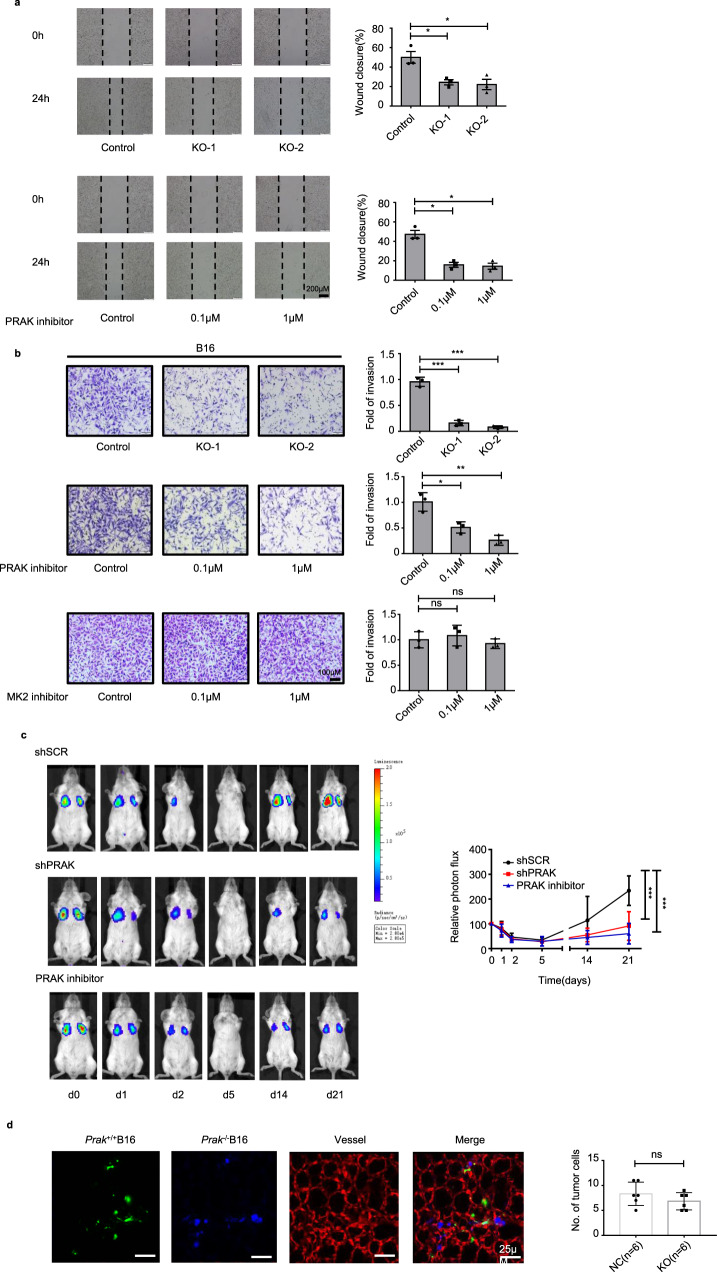
Fig. 3. PRAK promotes tumor cell invasion in vitro and colonization in vivo.
a Wound healing assay was performed to compare the migration of Prak+/+ versus Prak−/− B16 clones (top) or Prak+/+ cells in the presence or absence of the PRAK inhibitor GLPG0259 (bottom). The experiments were repeated three times with triplicates. Representative images and quantification of wound closure are shown. Error bars represent s.e. Scale bars, 200 µm. *p < 0.05. b Cell invasion was compared using Matrigel assay between Prak+/+ and Prak−/− B16 clones (top), and Prak+/+ cells in the absence or presence of PRAK inhibitor (middle) or MK2 inhibitor PF3644022 (bottom). The experiments were repeated at least three times. Representative images and quantification of fold of invasion are shown. Error bars represent s.d. Scale bars, 100 µm. ns, no significant, *p < 0.05, **p < 0.01, ***p < 0.001. c MDA-MB-231-Luc-D3H2LN cells carrying shPRAK or control scrambled shRNA (shSCR) were intravenously injected into SCID mice. The PRAK inhibitor-treated group received daily intraperitoneal injection of inhibitor at 2 mg/kg from day 0 to 4. Lung metastasis was monitored by bioluminescent imaging at different time points. Representative images are shown on the left. Data collected from five mice in each group are presented as mean ± s.d. ***p < 0.001. d Equal numbers of Prak+/+ (green) and Prak−/− (blue) B16 cells were mixed and injected into the mouse through the tail vein. Colonization of tumor cells in the pulmonary parenchyma was examined using confocal microscopy after perfusion. Representative images are shown at hour 6 post-injection. The blood vessels were stained red. The experiments were repeated at least three times with similar results. p-value was determined by a two-tailed, unpaired t-test.

