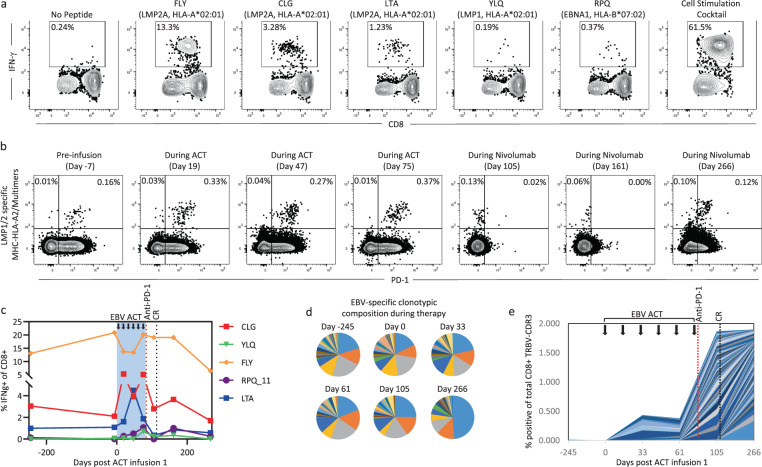
Fig. 2. EBV-specific immunological monitoring following immunotherapy.
a The specificity of T cells generated for cellular therapy was assessed using a standard intracellular cytokine assay following recall with HLA-matched peptide epitopes. Flow cytometry plots show the frequency of CD8+ T cells specific for six different EBV-encoded peptides or a positive control cell stimulation cocktail (eBioscience). b PBMC isolated during the course of treatment were assessed for PD-1 expression and the presence of EBV-specific T cells using a pool of HLA-A*02:01-restricted MHC dextramers. Plots show the proportion of MHC multimer-specific CD8+ T cells that co-express PD-1. c PBMC isolated during the course of treatment were stimulated for 2 weeks using an adenoviral vector encoding EBNA1 and multiple CD8+ T cell epitopes from LMP1 and LMP2 (AdE1-LMPpoly), then recalled with HLA-matched peptides. Data represent the proportion of IFN-γ producing CD8+ T cells in response to each peptide. d TRBV-CDR3 deep sequencing analysis was performed on two sets of samples: 1. CD8+ T cells sorted from PBMC isolated during the course of treatment, and 2. MHC multimer+ CD8+ T cells sorted from the ACT product. Pie charts show the proportions of MHC multimer+ EBV-specific TRBV sequences from the ACT product that were also detected in the PBMC during the course of treatment. Each wedge represents an individual clonotype and identical clonotypes in each pie chart are represented by the same color. Only clonotypes that were present in the MHC multimer+ population from the ACT product are included. e The chart shows the frequency of novel clonotypes in the total CD8+ T cell population that significantly expanded after the commencement of ACT. Each color represents an individual clonotype. Only clonotypes that significantly expanded after the commencement of ACT are included.

