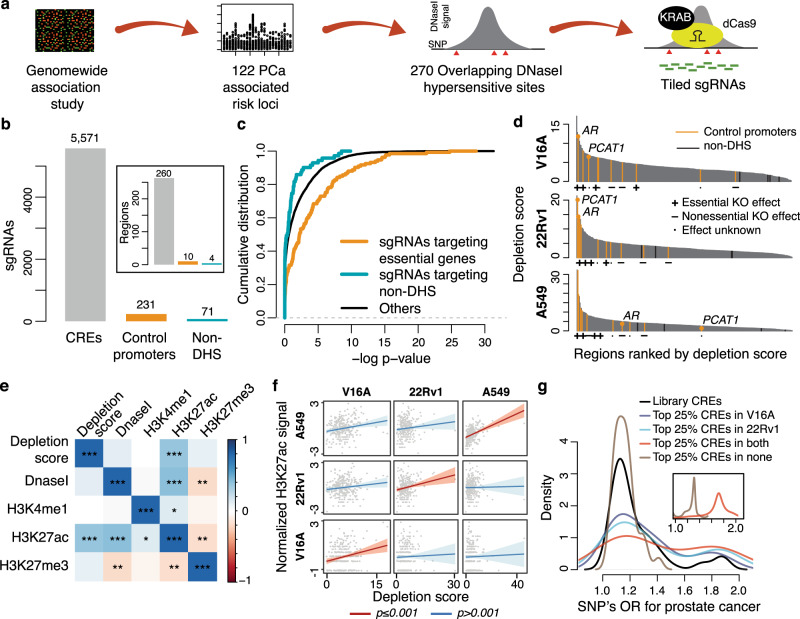
Fig. 1. CRISPRi screening of prostate cancer risk CREs.
a Schematic of rCRE selection and sgRNA design. b Distribution of sgRNAs targeting rCREs or control regions. The barplot in the inset indicates the number of regions in the library. c The cumulative distribution of depletion p-values of sgRNA targeting control promoter regions that are essential for growth in Achilles DepMap project (orange), sgRNAs targeting non-DNaseI hypersensitive sites (green), and sgRNAs targeting rCREs (black). Depletion p values were estimated using the tool MAGeCK (see ‘Methods’). d rCREs ranked by their depletion scores in three cell lines. Promoters of two prostate-specific oncogenes, AR and PCAT1, are labeled. The panels below the plots indicate the knockout effects of the control genes on respective cell growth as observed in Achilles DepMap project. e Correlation of LNCaP ChIP-seq signals of several histone marks with the depletion score in LNCaP-derived V16A cells. P values are estimated using Spearman’s correlation test. The colors of the box correspond to the correlation coefficient and the * corresponds to the statistical significance of correlation test. *, p ≤ 0.05; **, p ≤ 0.01; ***, p ≤ 0.005. f Linear regression between H3K27ac ChIP-seq signals and CRISPRi depletion score in cell line-specific manner. The solid lines denote the best fit for the regression model and the shaded areas denote 95% confidence interval. P value is calculated using linear regression analysis. g Distribution of odds ratio for PCa conferred by the risk SNPs within library rCREs. The black line denotes OR of risk SNPs in rCREs in the library; the colored lines denote top 25% rCREs when ranked by their depletion scores in PCa cell lines. The inset plot demonstrates the OR distribution by risk SNPs in bottom 75% rCREs (brown) and top 25% rCREs in both V16A and 22Rv1 cells (red) normalized by the overall OR distribution of all library risk SNPs. The inset axes are the same as the main plot axes.

