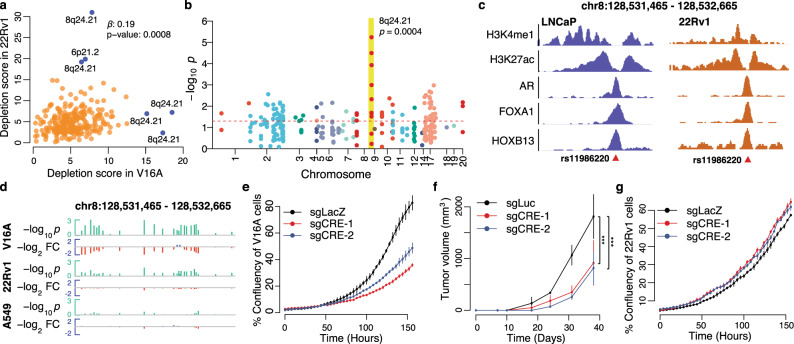
Fig. 2. The essential rCREs are enriched in 8q24.21 region.
a Depletion score of rCREs in V16A and 22Rv1 cells. The blue points indicate the outlier rCREs in linear regression between the cell lines. The regression coefficient, β, and the p value are calculated using linear regression analysis between the depletion scores after removing the six outliers. b The essential rCREs are overrepresented in the 8q24.21 region in V16A cells (p = 0.0004, Chi-sq test). Each circle denotes a library rCRE. The size of the circle is relative to the depletion fold change. See Supplementary Fig. 2 for other cell lines. c ChIP-seq signals of histone modifications and three important transcription factors in the rCRE region of chr8:128531465–128532665 in LNCaP and 22Rv1 cells. Risk SNP rs11986220 is located close to the center of transcription factors binding site. d Overview of p value and fold change at day 16 compared to day 0 of the individual sliding windows targeting the rCRE chr8:128531465–128532665. The green bars indicate –log2 p values; the red bar indicates fold change of sgRNAs in day 16 compared to day 0. FC fold change. Depletion p values and fold changes were estimated using the tool MAGeCK (see ‘Methods’). e Growth of V16A cells in vitro upon suppression of chr8:128531465–128532665 by two independent sgRNAs using dCas9-KRAB system. Data are represented as Mean ± s.d. (n = 2). f Tumor growth in a V16A-inoculated mouse xenograft upon injection of respective sgRNAs. Data are represented as Mean ± s.d. (n = 3). P values were estimated using ANOVA test. *** denotes a p value of 0.007. g Growth of 22Rv1 cells upon suppression of this rCRE using the same sgRNAs by dCas9-KRAB system. Data are represented as Mean ± s.d. (n = 2). Source data are provided as a Source Data file.

