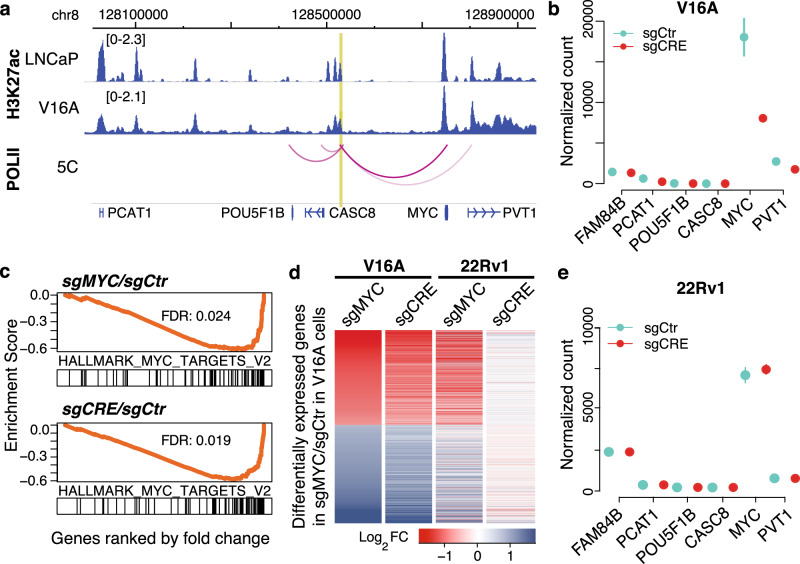
Fig. 3. The rCRE chr8:128531465–128532265 regulates MYC in V16A but not in 22Rv1 cells.
a The top two tracks demonstrate the H3K27ac ChIP-seq signal in LNCaP and V16A cells. The arc track represents the interactions between this rCRE and neighboring promoter regions as determined by ENCODE POLII 5C data in LNCaP cells. The intensity of the arc color represents the interaction strength. The bottom track represents the RefSeq gene annotation. The chromosomal positions are of the genome assembly Hg19. b Expression of neighboring genes as determined by RNA-seq upon repression of the rCRE chr8:128531465–-128532665 by dCas9-KRAB in V16A cells. The data are shown in mean ± s.d. (n = 2). Source data are provided as a Source Data file. c Gene set enrichment analysis shows that the hallmark MYC target genes (MSigDB H collection) are most overrepresented among the genes downregulated by repression of the MYC promoter (upper panel) or rs11986220-CRE (lower panel). See Supplementary Fig. 3 for overall gene set enrichment analysis. d Changes in transcriptome-wide gene expression upon repression of the rCRE (by sgCRE) and the MYC promoter region (by sgMYC) in V16A and 22Rv1 cells. Only the genes differentially expressed (FDR < 0.1 and fold change >1.5, negative binomial test) upon MYC promoter repression (sgMYC) in dCas9-KRAB V16A cells are shown. The genes are sorted by fold change in V16A cells. FC fold change. e Expression of neighboring genes as determined by RNA-seq upon repression of the rCRE by dCas9-KRAB in 22Rv1 cells. The data are shown in mean ± s.d. (n = 2). Source data are provided as a Source Data file.

