Figure 3.
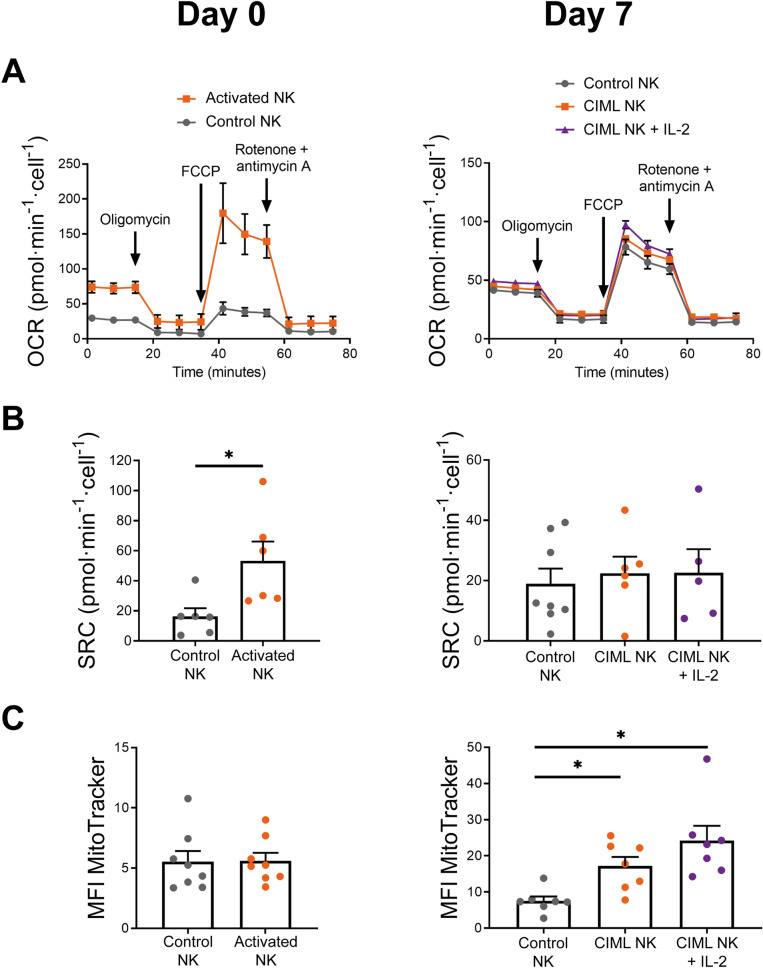
Mitochondrial activity and mass of human IL-12/15/18-stimulated NK cells. (A) Representative experiment of Seahorse XF analyzer with the Mito Stress Test kit. Means ± standard deviation are depicted. (B) Bar charts representing spare respiratory capacity (SRC), measured as the difference between maximal and basal mitochondrial respirations. (C) Bar charts representing mitochondrial mass, measured as the median fluorescence intensity (MFI) of MitoTracker Green. Graphs show data of control NK cells and IL-12/15/18-stimulated NK cells (activated NK) (Day 0, left column), and after 7 days of culture with IL-15 (control NK or CIML NK) or IL-2 (CIML NK + IL-2) (Day 7, right column). Means ± SEM are depicted in bar graphs. Statistical analyses were performed using Wilcoxon matched-pairs signed rank test. Each dot represents an independent experiment from a different donor (n = 5–8). *P < 0.05.

