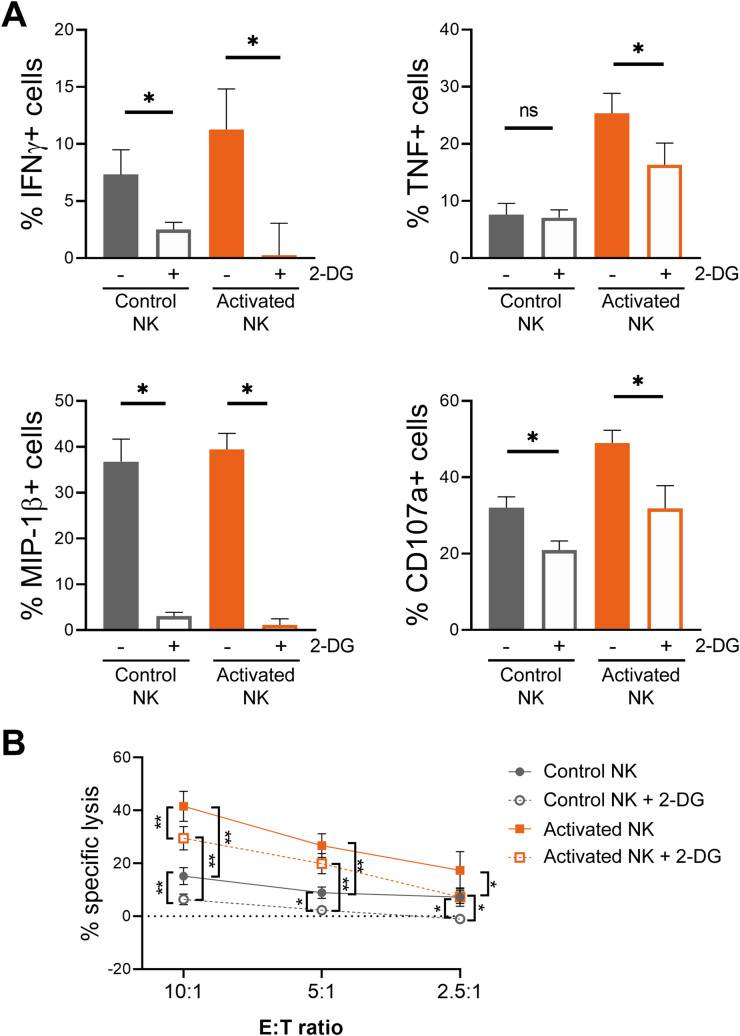
Figure 4.
2-DG-induced inhibition of specific cytokine/chemokine production, degranulation and cytotoxic activity of human IL-12/15/18-stimulated NK cells at day 0. (A) Control NK cells and IL-12/15/18-stimulated NK cells (activated NK) were co-cultured with K562 target cells (E:T ratio = 1:1) for 7 h in the presence and absence of 50 mM 2-DG. Bar graphs showing the specific percentage of cells that produce IFNγ, TNF and MIP-1β, or degranulate (CD107a), in the presence and absence of 2-DG. Specific percentage of positive cells was calculated by subtracting the percentage of positive cells for each measured function in the absence of stimuli. Means ± SEM are depicted. Statistical analyses were performed using Wilcoxon matched-pairs signed rank test. n = 7. (B) Control and activated NK cells were co-cultured with calcein-AM-labeled K562 target cells at different E:T ratios for 3 h in the presence and absence of 50 mM 2-DG. Percentage of specific lysis was measured based on calcein-AM release. Means ± SEM are depicted. Statistical analyses were performed using Wilcoxon matched-pairs signed rank test. n = 7–8. ns = non-significant, *P < 0.05, **P < 0.01.

