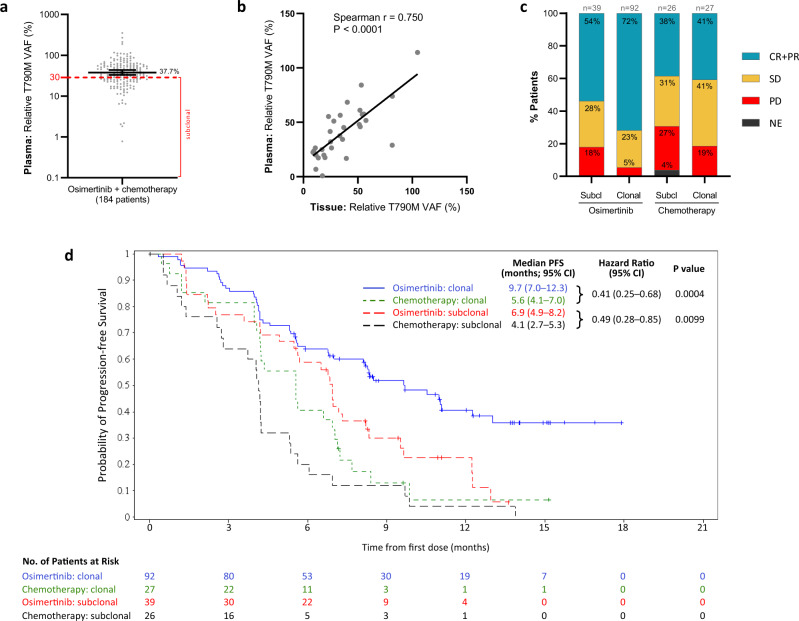
Fig. 2. T790M clonality levels in baseline plasma and its association with tumour response and progression-free survival (PFS) on osimertinib and chemotherapy.
a Distribution of relative T790M VAF in 184 selected AURA3. Black line represents the median (37.7%), ticks mark 95% CI (33.0–43.8%); red dashed line marks 30% T790M subclonality threshold. b Correlation between relative T790M VAF values calculated from plasma and tissue NGS data from 31 AURA3 patients for which both values were available. Spearman correlation = 0.750; P value = 0.0000012. c Patient’s best objective response (BOR) depending on the T790M subclonality group and treatment arm. BOR assessed according to Response Evaluation Criteria in Solid Tumours (RECIST). Relative T790M VAF of 30% was chosen as a subclonality threshold. CR + PR complete and partial response, SD stable disease, PD progressive disease, Subcl T790M subclonal, Clonal T790M clonal. d Kaplan–Meier estimates of the duration of PFS in subpopulations of patients with T790M subclonal and clonal tumours treated with osimertinib or chemotherapy. The tick marks indicate censored data. A hazard ratio <1 favours osimertinib. The HR, its two-sided 95% CI and P value are obtained from the unadjusted Cox proportional hazards.

