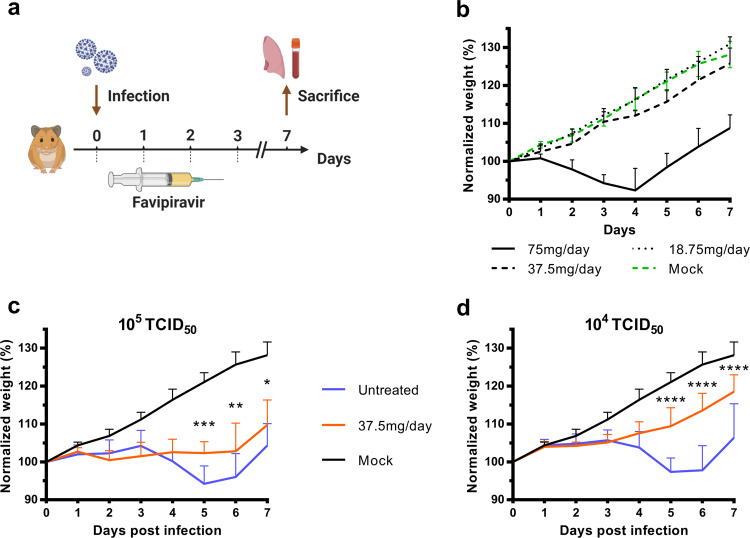
Fig. 2. Clinical follow-up of animals.
a Experimental timeline. b Evaluation of the toxicity of the three doses of favipiravir (mg/day TID) with groups of four uninfected animals following the experimental timeline described in panel a but without infection. c, d Clinical follow-up with groups of 10 animals infected respectively with 105 and 104 TCID50 of virus and treated with a dose of favipiravir of 37.5 mg/day TID. Normalized weight at day n was calculated as follows: % of initial weight of the animal at day n. Data represent mean ± SD (details in Supplementary Data 2). Two-sided statistical analysis were performed using two-way ANOVA with Post-hoc Dunnett’s multiple comparisons test or Post-hoc Sidak’s multiple comparisons test (details in Supplementary Data 5). ****, ***, ** and * symbols indicate that the average value for the group is significantly lower than that of the untreated group with a p-value < 0.0001, ranging between 0.0001–0.001, 0.001–0.01, and 0.01–0.05, respectively Source data are provided as a Source data file.

