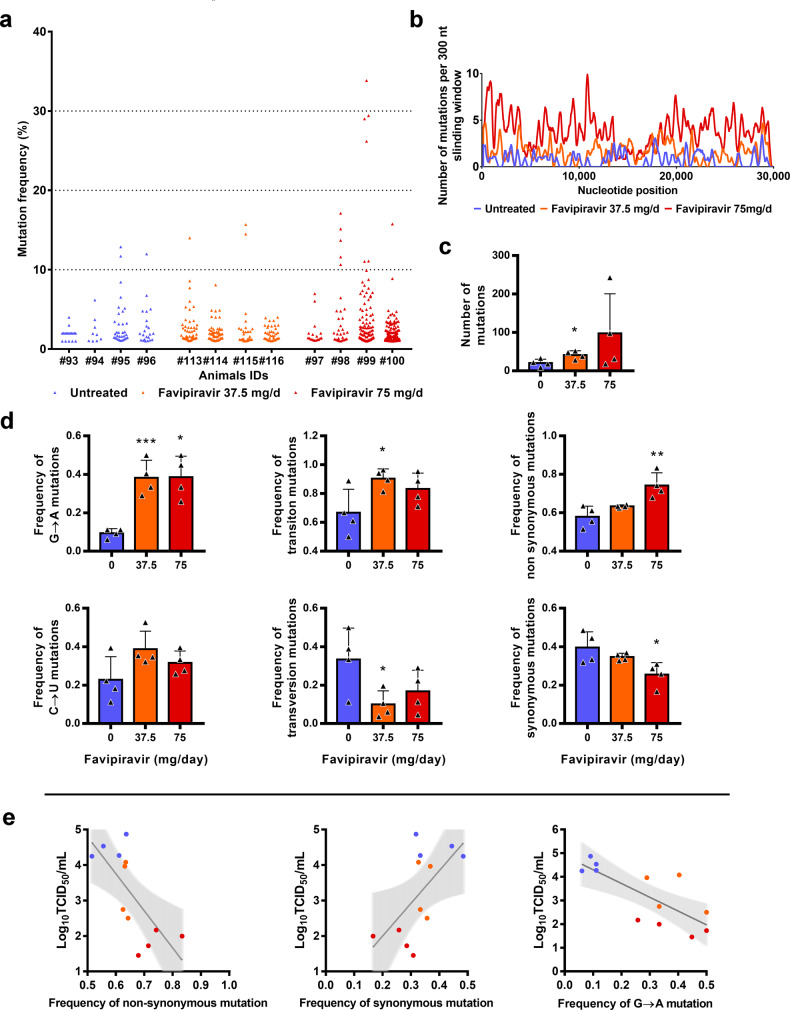
Fig. 5. Mutagenic effect of favipiravir.
a Viral genetic diversity in clarified lung homogenates. For each condition, four samples were analyzed. Each triangle represents a mutation (only substitutions with a frequency ≥ 1% were considered). b Patterns of mutation distribution on complete viral genome. Each variable nucleotide position was counted only once when found. The variability was represented using 75 nt sliding windows. For each condition, variable nucleotide positions were determined and represented using a 300 nt sliding window. c Mean number of mutations (n = 4 samples/group). Data represent mean ± SD. d Mutation characteristics (n = 4 samples/group). For each sample, the frequency of a given mutation was calculated as follows: number of this kind of mutation detected in the sample divided by the total number of mutations detected in this sample. Data represent mean ± SD (details in details in Supplementary Data 10 and 13). Two-sided statistical analysis were performed using Shapiro–Wilk normality test, Student t-test, Mann–Whitney test, and Welch’s test (details in Supplementary Data 11 and 12). ***, ** and * symbols indicate that the average value for the group is significantly lower than that of the untreated group with a p-value ranging between 0.0001–0.001, 0.001–0.01, and 0.01–0.05, respectively. e Association between lung infectious titers (measured using a TCID50 assay) and frequency of non synonymous, synonymous and G → A mutations. Each dot represent data from a given animal. Statistical analysis was performed using univariate linear regression. The error band (in gray) represent the 95% confidence interval of the regression line. Source data are provided as a Source data file.

