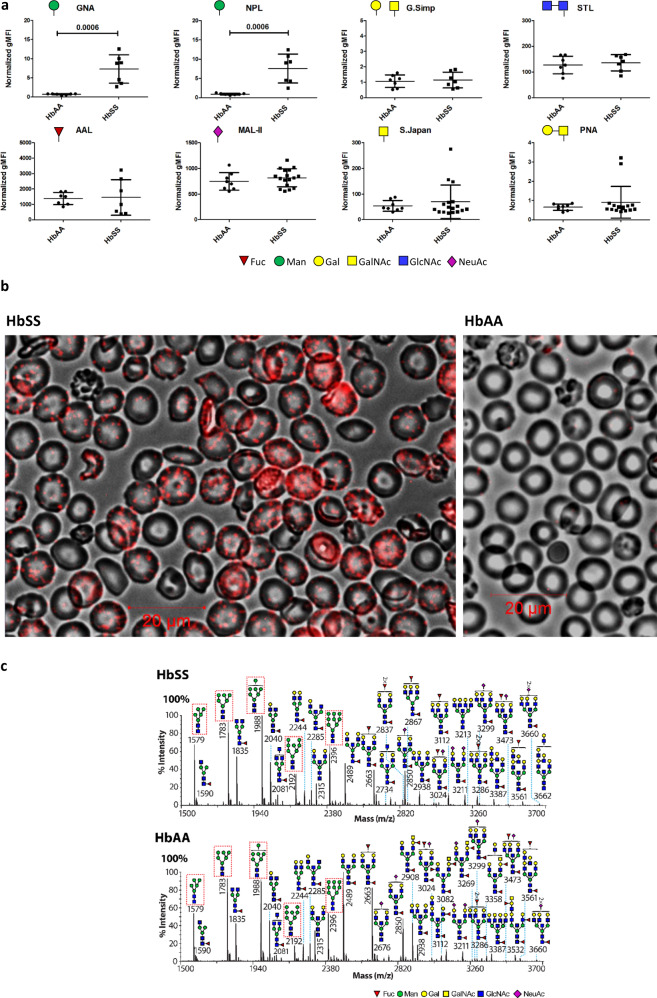
Fig. 1. HbSS RBCs are characterized by microdomain expression of surface mannoses.
Whole blood flow cytometry analysis of HbAA (normal hemoglobin) and HbSS (homozygous sickle cell hemoglobin) RBCs using fluorescently labeled plant lectins, detailed in “Methods” section. Vertical axes show normalized geometric mean fluorescence (gMFI). Symbols of terminal carbohydrates detected by plant lectins are indicated. Data shown as median +/− IQR, n = 7 per group for significant differences, 2 tailed Mann-Whitney p values shown, distinct samples measured once each, 3 separate experiments. Annotation uses conventional symbols for carbohydrates in accordance with http://www.functionalglycomics.org guidelines: purple diamond, sialic acids; yellow circle, galactose; blue square, N-acetyl glucosamine; green circle, mannose; red triangle, fucose. a Galanthus nivalis Agglutinin (GNA) lectin staining (red) of HbSS and HbAA RBCs, immunofluorescence, merged with the bright field. b MALDI-ToF mass spectra (m/z versus relative intensity) for glycomic analysis of N-glycans from membrane ghosts from individual HbSS and HbAA donors. Red boxes indicate high mannose structures. Annotation uses conventional symbols for carbohydrates in accordance with http://www.functionalglycomics.org guidelines: purple diamond, sialic acids; yellow circle, galactose; blue square, N-acetyl glucosamine; green circle, mannose; red triangle, fucose. Only major structures are annotated for clarity. Full spectra from both HbSS and HbAA donors are shown in Supplementary Fig. 3c.

