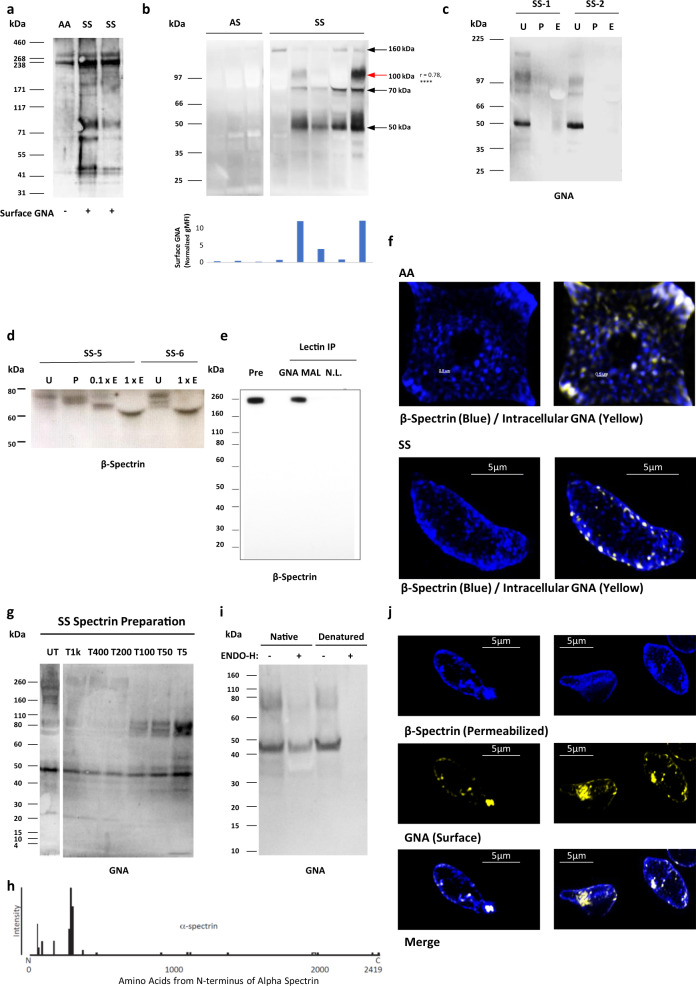
Fig. 4. High mannose decoration of spectrin containing fragments in sickle cell disease.
a Galanthus nivalis Agglutinin (GNA) lectin western blot from healthy (HbAA) and homozygote sickle hemoglobin (HbSS) ghosts. b Above are shown further GNA lectin western blots from HbAA and HBSS ghosts. The histogram below the blot shows the flow cytometrically measured surface GNA lectin staining values of the RBCs used to make the ghosts, with each bar corresponding to the cells used to make the western lane above. The r-value to the right of the 100 kDa size label is Spearman’s rank correlation coefficient between GNA lectin staining values and band intensities, both classified ordinally as high, medium, or low (post hoc analysis p = 1.3 × 10⁻⁶, n = 27 measurements from 22 individuals, no statistical adjustment made for other bands). c GNA lectin blot from HbSS ghosts: untreated (U), treated by PNGase (P) or Endo-H (E). d High exposure β-spectrin blot showing PNGase and partial/full (0.1×/1×) Endo-H digestion of two HbSS ghosts. e Lectin precipitation of healthy ghosts with GNA or Maackia amurensis Lectin II (MAL-II) lectins. No lectin control is also shown. Immunoblot with the β-spectrin specific antibody. f Super-resolution microscopy image of spectrin membrane skeleton (blue) from healthy (AA) and sickle cells (SS). Yellow clusters of GNA staining are overlaid. 3D image is sliced to reveal a single sheet of membrane skeleton network. g GNA lectin blot of spectrin released from HbSS ghosts after digestion with trypsin for one hour. Untreated (UT), Tx indicates the dilution factor of trypsin relative to spectrin material. h The amino acid sequence of α-spectrin showing peptide coverage (presence or absence of bar above the line) and intensity (proportional to the height of the bar) from proteomic analysis of F40 following chymotrypsin treatment. i GNA lectin blots showing Endo-H treatment of the 10 kDa concentrate from e under native or denaturing conditions (urea/SDS/2-mercaptoethanol) for 24 h. j 3D SIM super-resolution microscopy of surface GNA lectin binding and internal β-spectrin in HbSS RBC. Cells are first stained with GNA lectin (yellow), then permeabilized, and stained with anti-spectrin antibody (blue) (k).

