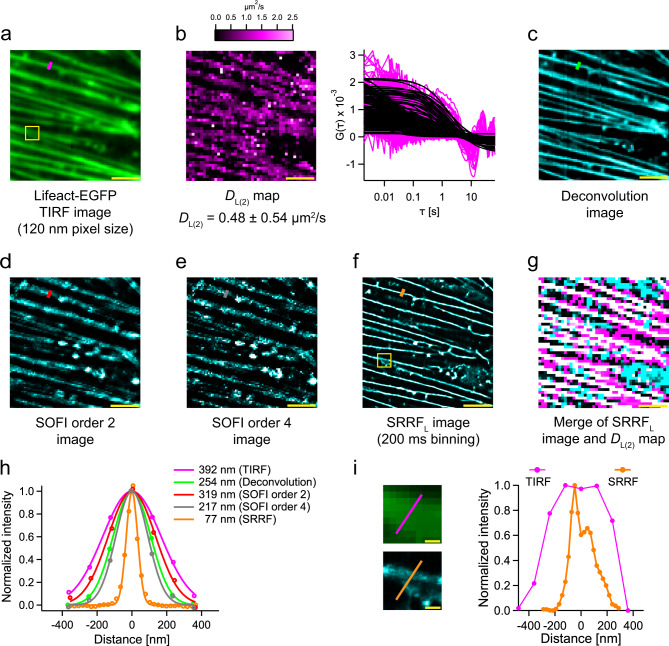
Fig. 2. Multi-parametric analysis from a single channel fluorescence data set.
a TIRF image of CHO-K1 cell expressing Lifeact-EGFP at ×200 magnification (120 nm pixel size). b The D map without thresholding (DL(2) = 0.48 ± 0.54 µm2/s) is shown on the left. The COV is 113%. Representative ACFs are shown on the right. c–e Deconvolution image, SOFI image of order 2, SOFI image of order 4, respectively. f SRRFL image (200 ms binning; refer Supplementary Fig. 4) of the cell in (a). g Merge of the SRRFL image and DL(2) map. The SRRFL, DL(2) and correlated pixels are coloured cyan, magenta and white, respectively. White pixels identify where the SRRFL image and the diffraction-limited DL(2) map coincide. Cyan pixels show fibres in SRRFL but no correlated D is found (SRRF artefacts). Magenta pixels show a D consistent with diffusion on fibres but no structure in SRRF. Due to the effect of the diffraction limit of Imaging FCS, not all pixels consistent with diffusion on fibres are observed in the SRRFL image. h Thickness (FWHM of the Gaussian fit) of the actin fibre in TIRF image (magenta line in (a)) = 392 nm. Thickness of the actin fibre after deconvolution (green line in (c)) = 254 nm. The thickness of the actin fibre after SOFI-order 2 (red line in (d)) = 319 nm. The thickness of the actin fibre after SOFI-order 4 (grey line in (e)) = 217 nm. The thickness of the actin fibre after SRRF (orange line in (f)) = 77 nm. Refer to Supplementary Fig. 6 for more details. i Enlarged views of yellow boxes in images (a) and (f). The intensity profile shows the actin fibre branching point (indicated by the orange line on the enlarged SRRF image). The peak-to-peak resolution is 96 nm at this point. The pixel sizes reported are after magnification (refer Table 3). The scale bars shown in yellow measure 2.5 µm in images (a)–(g), and 250 nm in (i). All values are reported as Mean ± SD. The analyses were performed on four cells from four different preparations of a single batch of cells with similar results. One representative cell is shown here. Source data is available as a Source data file.

